Bitcoin Historical Data Analysis
Project Information
- Category: Data Analytics / Financial Analysis / Cryptocurrency
- Client/Context: Quantum Analysis/Market Trend Analysis & Research
- Project Date: December 2023
- Tools Used: Power BI (Power Query, DAX)
- Data Source: Bitcoin Historical Data (Jan 2012 - March 2021)
- Project URL: View Live Dashboard
Bitcoin Historical Data Analysis: Unveiling Market Trends and Volatility
Summary
This Power BI project presents a comprehensive analysis of Bitcoin's historical market data at 1-minute intervals from January 2012 to March 2021. Leveraging a rich dataset including Open, High, Low, Close (OHLC) prices, Volume in BTC, Volume in indicated currency, and Weighted Bitcoin Price, the dashboard provides critical insights into Bitcoin's market behavior and evolution. The project involved robust data cleaning and transformation using Power Query to handle missing timestamps and NaN values. The analysis focuses on key metrics such as total trades, trading volumes, price trends, and the distribution of trading activity by year, month, and quarter. This dashboard aims to provide researchers, analysts, and cryptocurrency enthusiasts with a clear, interactive view of Bitcoin's past performance and underlying market dynamics.
1. Introduction: Understanding Bitcoin's Market Evolution
Bitcoin, as the pioneering cryptocurrency, has dramatically influenced the financial landscape since its inception in 2009. Its decentralized nature and blockchain technology have fostered a unique market. Analyzing its historical data is crucial for understanding its growth, volatility, and market cycles. The dataset, sourced from various exchanges, offers granular 1-minute interval data, presenting both a challenge due to its raw nature (missing timestamps, NaNs) and a rich opportunity for deep market insights. This project tackles these data complexities to transform raw market data into actionable intelligence, revealing key trends and patterns over nearly a decade.
2. Project Objectives & Goals
The primary objectives for this Power BI project were defined to provide comprehensive insights into Bitcoin's historical market dynamics:
Overall Objectives:
- To perform robust exploratory analysis of historical Bitcoin market data to identify significant price and volume trends.
- To address complex data quality challenges** inherent in high-frequency financial data (missing timestamps, NaNs) through comprehensive cleaning and transformation.
- To provide actionable insights into Bitcoin's market performance, including its highest and lowest price points, trading volume distribution, and weighted price trends.
Project Goals & Deliverables:
- Overall Market Statistics Overview: Display key metrics such as Total No. of Trades, Total Volume (BTC), Total Volume (Currency), Highest Price of Bitcoin, and Lowest Price of Bitcoin.
- Trend of Average Weighted Price by Year: Visualize the yearly trend of Bitcoin's average weighted price to observe its growth trajectory.
- Total Volume (BTC) by Year: Analyze the distribution of Bitcoin trading volume across different years.
- Min and Max of Low and High by Year and Month: Track the minimum low and maximum high prices over time to understand price volatility.
- Total Volume (Currency) by Quarter: Identify quarterly patterns in trading volume denominated in currency.
- Interactive Date Filtering: Allow users to filter data by specific date ranges.
- Interactive Price Range Filtering: Enable filtering based on 'Highs' (price range) to focus on specific price behaviors.
3. Data Scope & Metrics
The analysis leveraged a granular dataset of Bitcoin's market activity at 1-minute intervals.
Data Source:
- Global Shark Attack File (Historical Data): This dataset provides details on shark attacks including location, activity, victim info (name, gender, age), shark species, etc.
- Bitcoin Historical Data (Jan 2012 - March 2021): CSV files containing minute-to-minute updates from select Bitcoin exchanges, including OHLC (Open, High, Low, Close), Volume in BTC and indicated currency, and weighted bitcoin price. Timestamps are in Unix time.
- Key Columns Relevant to Analysis:
- `Timestamp` (Unix time)
- `Open`, `High`, `Low`, `Close` (OHLC prices)
- `Volume_BTC` (Volume in Bitcoin)
- `Volume_Currency` (Volume in indicated currency)
- `Weighted_Price` (Weighted Bitcoin Price)
Key Data Points & Metrics Captured and Displayed:
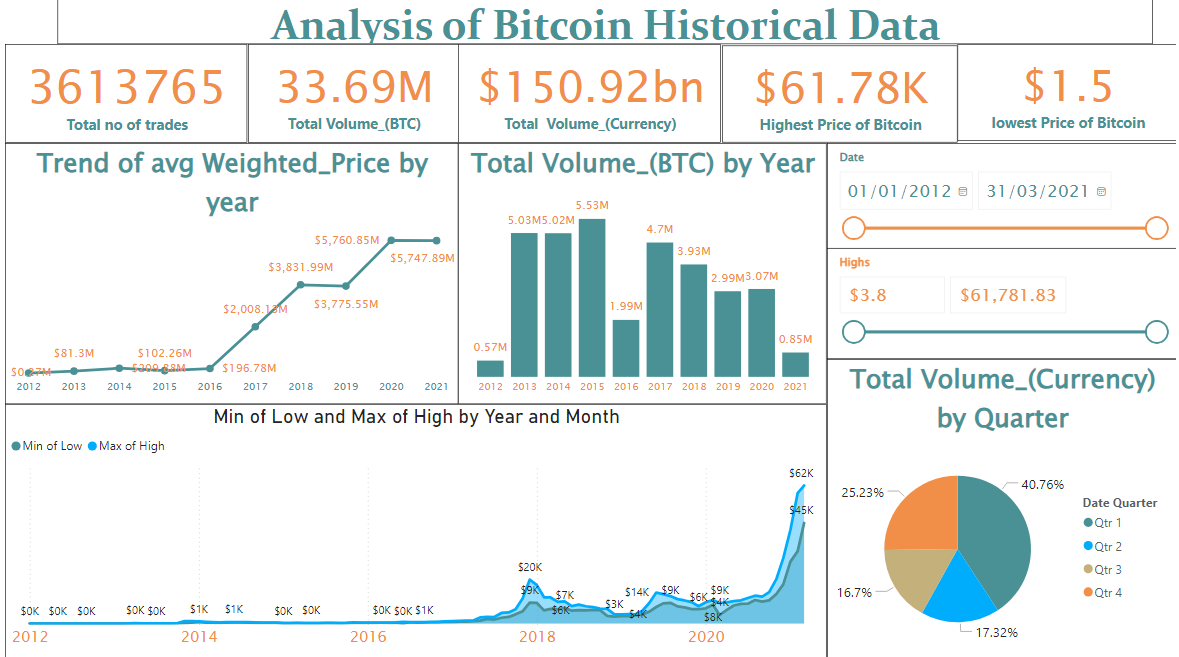
- Total No. of Trades: 3,613,765
- Total Volume (BTC): 33.69M BTC
- Total Volume (Currency): $150.92Bn
- Highest Price of Bitcoin: $61.78K
- Lowest Price of Bitcoin: $1.5
- Trend of Avg Weighted Price by Year: Shows a dramatic increase, especially from 2017 onwards, reaching $5,747.89 in 2020.
- Total Volume (BTC) by Year: High volumes in 2013 (5.03M BTC), 2014 (5.53M BTC), 2017 (4.7M BTC), and 2018 (3.93M BTC).
- Min of Low and Max of High by Year and Month: Visualizes the widening gap between min low and max high prices, indicating increased volatility over the years, particularly from 2017-2020.
- Total Volume (Currency) by Quarter: Quarter 1 (40.76%) and Quarter 4 (25.23%) show the highest trading volumes.
Key Insights Derived from Data:
- Bitcoin has experienced exponential price growth, with its average weighted price skyrocketing in recent years (2017-2020).
- Despite price fluctuations, trading volume in BTC has remained substantial, with peaks in early years (2013-2014) and later significant activity (2017-2018).
- The volatility of Bitcoin has increased significantly over time, as evidenced by the widening range between the minimum low and maximum high prices.
- Trading activity tends to be higher in the first and fourth quarters of the year, suggesting potential seasonal patterns or end-of-year/start-of-year market dynamics.
- The journey from a lowest price of $1.5 to a highest of $61.78K highlights Bitcoin's immense appreciation and market capitalization growth over the analyzed period.
4. Dashboard Design & Key Insights
The "Analysis of Bitcoin Historical Data" dashboard is designed to provide a comprehensive, interactive overview of Bitcoin's market performance.
Dashboard Features and Key Insights:
4.1 Executive Summary & Key Performance Indicators (KPIs)
Prominent KPIs at the top provide an immediate snapshot of overall market activity:
- Total No. of Trades: 3,613,765
- Total Volume (BTC): 33.69M BTC
- Total Volume (Currency): $150.92Bn
- Highest Price of Bitcoin: $61.78K
- Lowest Price of Bitcoin: $1.5
4.2 Price and Volume Trends
- Trend of Avg Weighted Price by Year (Line Chart): This chart clearly visualizes Bitcoin's parabolic growth, especially notable from 2017 onwards, reaching high values in 2020 and 2021.
- Total Volume (BTC) by Year (Bar Chart): Illustrates the annual distribution of Bitcoin trading volume, showing peaks in early years (2013-2014) and strong activity in later years (2017-2018), indicating consistent market liquidity.
- Min of Low and Max of High by Year and Month (Area Chart): This dual-axis chart effectively highlights increasing price volatility, with the spread between the minimum low and maximum high prices widening over time, particularly in the later years of the dataset.
4.3 Quarterly Volume Distribution
- Total Volume (Currency) by Quarter (Donut Chart): This chart provides insight into seasonal trading patterns, showing that Q1 accounts for the largest share (40.76%) of total currency volume, followed by Q4 (25.23%).
4.4 Interactive Filters
- Date Slicer: Allows users to dynamically select a date range (e.g., "01/01/2012 - 31/03/2021") to focus the analysis on specific periods.
- Highs Slicer: Enables filtering by a specific range of Bitcoin 'High' prices, facilitating in-depth analysis of market behavior within certain price thresholds.
The interactive elements and clear visualizations empower users to deep dive into Bitcoin's historical performance, understand its market dynamics, and observe volatility trends.
5. Technical Approach & Tools
The project involved crucial data cleaning and transformation steps to handle the high-frequency, sometimes inconsistent nature of financial market data, followed by robust analysis in Power BI:
- Data Acquisition & Ingestion: Bitcoin historical data, provided as CSV files at 1-minute intervals, was imported into Power BI Desktop.
- Data Cleaning & Transformation (Power Query in Power BI): Power Query Editor was essential for preparing the raw dataset.
- Handling Missing Values & Inconsistencies: Addressed `NaN` values and potential missing timestamps (as noted in the data context: "Timestamps without any trades or activity have their data fields filled with NaNs. If a timestamp is missing, or if there are jumps, this may be because the exchange (or its API) was down...") by employing appropriate fill-down/up methods or interpolation as suitable for time-series financial data.
- Timestamp Conversion: Converted Unix timestamps to a standard datetime format for proper time-series analysis and visualization.
- Data Type Standardization: Ensured all numerical columns (OHLC, Volume, Weighted Price) were correctly typed to facilitate accurate calculations.
- Deduplication: Verified and removed any duplicate entries to ensure data integrity and avoid erroneous calculations.
- Custom Columns for Time Intelligence: Created columns for 'Year' and 'Quarter' to enable granular temporal analysis and visualization.
- DAX (Data Analysis Expressions) Calculations: DAX measures were created to compute key business metrics and aggregations:
- `Total no of trades = COUNTROWS(TradesTable)`
- `Total Volume_BTC = SUM(TradesTable[Volume_BTC])`
- `Total Volume_Currency = SUM(TradesTable[Volume_Currency])`
- `Highest Price of Bitcoin = MAXX(ALL(TradesTable), TradesTable[High])`
- `Lowest Price of Bitcoin = MINX(ALL(TradesTable), TradesTable[Low])`
- Measures for average weighted price, and aggregation of volume by year and quarter.
- Data Visualization & Dashboarding (Power BI Desktop): The dashboard was designed with a focus on clear and intuitive representation of financial trends:
- KPI Cards: Utilized for high-level summaries of key market metrics.
- Line Charts: For visualizing average weighted price trends and min/max price ranges over time, effectively showing growth and volatility.
- Bar Charts: Used to display total volume by year.
- Donut Chart: For a clear representation of currency volume distribution by quarter.
- Slicers: Implemented for dynamic filtering by date ranges and price 'Highs', providing interactive exploration capabilities.
- Publishing & Sharing (Power BI Service): The final interactive report was published to the Power BI Service for wider access and sharing with stakeholders interested in cryptocurrency market analysis.
6. Impact & Business Value
This Power BI dashboard for Bitcoin Historical Data Analysis delivers significant value to various stakeholders:
- Market Trend Identification: Enables quick identification of Bitcoin's historical price appreciation and trading volume trends, crucial for investors and analysts.
- Volatility Assessment: Provides clear insights into Bitcoin's price volatility over time, aiding risk assessment for potential investments.
- Informed Decision Making: Equips financial analysts, traders, and researchers with a data-driven tool to understand market cycles and make more informed decisions.
- Resource for Research: Serves as a valuable resource for academic and independent researchers studying cryptocurrency markets and blockchain technology.
- Demonstration of Data Handling Skills: Showcases advanced data cleaning and transformation capabilities, particularly in managing high-frequency, often messy, financial time-series data.
- Seasonal Pattern Recognition: Highlights periods of higher trading activity (e.g., Q1 and Q4), which can inform trading strategies or market predictions.
7. Conclusion
This Power BI project successfully provides a robust and interactive analytical tool for understanding Bitcoin's historical market behavior from 2012 to 2021. By meticulously cleaning and transforming a complex, high-frequency dataset, critical insights into price trends, trading volumes, volatility, and quarterly patterns have been revealed. The dashboard serves as an invaluable resource for anyone seeking to understand the past dynamics of the world's leading cryptocurrency. This analysis underscores the power of data visualization in turning raw, extensive data into clear, actionable intelligence for financial analysis and research.