E-commerce Sales Profitability Analysis
Project Information
- Category: Data Analytics / Business Intelligence / E-commerce
- Client: Quantum Analytic (Internship Project)
- Project Date: Dec 2023
- Tools Used: Power BI, Microsoft Excel
- Data Source: E-commerce Sales Dataset
- Project URL: View Live Dashboard
E-commerce Sales Profitability Analysis
Summary
This project delves into the profitability of e-commerce sales across various channels, utilizing a comprehensive dataset to uncover key financial insights and optimize operational strategies. My primary objective was to transform raw sales and expense data into actionable intelligence, enabling a clear understanding of performance across fulfillment methods like Amazon and Merchant, comparing pricing strategies across multiple online stores, and analyzing customer-specific purchasing patterns. Through interactive Power BI dashboards, as demonstrated by the 'E-COMMERCE SALES DASHBOARD', I highlighted profit margins, cost structures, and sales trends. The insights derived from this analysis are designed to empower e-commerce businesses to make data-driven decisions that enhance profitability, streamline operations, and maximize return on investment in today's competitive marketplace.
1. Introduction: Uncovering E-commerce Profitability
The e-commerce landscape is complex, with myriad sales channels, fulfillment methods, and pricing strategies influencing overall profitability. Understanding the intricate relationships between these factors is crucial for businesses aiming to thrive. This project tackles this challenge by analyzing a detailed e-commerce sales dataset that provides a granular view of transactional data, product information, and associated costs.
My analysis focuses on key dimensions of e-commerce operations, including:
- Sales Channel Performance: Comparing the effectiveness and profitability of various platforms like Amazon and Merchant fulfillment.
- Pricing Strategy Comparison: Evaluating the impact of different MRPs (Maximum Retail Prices) across major online retailers (though specific store MRPs are not visible on the summary dashboard, the underlying data supports this analysis).
- Cost Structure Analysis: Deconstructing product costs (TP1/TP2) and their contribution to overall profitability alongside yearly expenses.
- Customer and Product Performance: Tracking individual item performance, customer purchase patterns, and the impact of promotions.
By dissecting these elements, my analysis aims to provide a holistic view of the factors driving profitability in e-commerce, offering clear, actionable recommendations for optimizing sales and cost management.
2. Project Objectives & Goals
I structured this project with clear objectives to deliver comprehensive insights into e-commerce sales profitability:
Overall Objectives:
- To identify and compare profitability across different sales channels and fulfillment methods.
- To analyze the effectiveness of pricing strategies on various e-commerce platforms.
- To understand the complete cost structure of products and its impact on profit margins.
- To uncover sales trends and customer purchasing behaviors to optimize inventory and marketing efforts.
- To provide actionable recommendations for cost-cutting measures and revenue maximization.
Project Goals:
- Sales Channel Profitability Comparison: Develop visualizations comparing the profitability of sales made through different fulfillment methods (e.g., Amazon FBA vs. Merchant fulfilled), highlighting their respective costs and revenue contributions. (As seen in the "Orders by Fulfillment" chart).
- Multi-Platform Pricing Analysis: Create charts that compare MRPs across different stores to identify optimal pricing strategies and margin potential. (While not directly visible on the summary dashboard, this was a key analytical goal).
- Comprehensive Cost & Revenue Breakdown: Implement a detailed analysis of product cost components (TP1/TP2), gross amounts, and yearly expenses to present a clear picture of profit margins per SKU and category. (Supported by the "Total International Sales by CUSTOMER" and overall revenue figures).
- Sales Trend & Customer Behavior Dashboard: Design interactive dashboards to track sales trends by month, category, and currency, alongside customer-specific gross amounts and rate information, enabling identification of top-performing SKUs and customer segments. (Clearly demonstrated by "Amazon Revenue Trend", "Customers by Size", and "Total International Sales by CUSTOMER").
- Inventory & Promotional Strategy Insights: Visualize stock levels and analyze the impact of offers and discounts on sales performance, informing inventory optimization and promotional campaign strategies. (Insights into popular sizes from "Customers by Size" can indirectly inform inventory).
- P&L Overview and Cost-Cutting Recommendations: Present a high-level Profit & Loss (P&L) overview incorporating yearly expenses to identify areas for potential cost savings, such as optimizing delivery options. (The high-level revenue numbers and fulfillment breakdown contribute to this).
3. Data Scope & Metrics
My analysis leveraged a rich E-commerce Sales Dataset, providing an in-depth look at profitability. This dataset encompasses a variety of sales channels and financial information, allowing for a multifaceted investigation.
Key Data Points & Metrics:
- Product Identifiers: SKU codes, design numbers, product categories, sizes, and colors.
- Sales Channels: Identification of sales via Amazon, Merchant, Shiprocket, INCREFF, and other channels.
- Pricing Information: MRPs across multiple stores: Ajio MRP, Amazon MRP, Amazon FBA MRP, Flipkart MRP, Limeroad MRP, Myntra MRP, and Paytm MRP.
- Transactional Parameters:
- Amount Paid by Customer: The actual price at which the product was sold.
- Rate per piece: Individual transaction rate.
- Date of Sale: For trend analysis.
- Month Category: Categorization by month.
- Fulfilled By: Method of fulfillment (e.g., Amazon, Merchant).
- B2B Status: Business-to-business transaction status.
- Quantity (Qty): Number of units sold.
- Currency: Transaction currency.
- Gross Amount: Total revenue from sales.
- Cost & Profit Data:
- TP1/TP2: Cost per piece information.
- Stock: Current inventory levels.
- Yearly Expenses_IIGF: Annual expenditure details.
- Calculated Metrics:
- Total International Sales Revenue ($15.77M on dashboard).
- Amazon Sales Revenue ($76.03M on dashboard).
- Total Orders (129K on dashboard).
- Number of Customers (149 on dashboard).
- `Profit Margin`: Calculated metric to determine profitability after all costs and expenses.
Key Insights Derived from Data:
- Channel Profitability Variance: Initial analysis revealed significant differences in profit margins between different fulfillment methods (Amazon vs. Merchant), often tied to their respective fulfillment fees and referral structures. This highlighted opportunities to prioritize more profitable channels or renegotiate terms.
- Dynamic Pricing Impact: Comparing MRPs across platforms showed how competitive pricing on one channel could lead to lower per-unit profits, even with higher sales volumes. This necessitated a balanced strategy, identifying platforms where premium pricing was sustainable without deterring sales.
- Cost Component Contribution: Detailed examination of TP1/TP2 against gross amounts and yearly expenses allowed for a granular understanding of cost drivers. Certain product categories or SKUs demonstrated higher inherent costs, impacting their overall profitability despite strong sales.
- Promotional Effectiveness: By tracking items sold with offers or discounts, I observed that while promotions boosted sales volume, they sometimes disproportionately eroded profit margins. This insight is crucial for crafting more effective, margin-preserving promotional strategies.
- Inventory Turnover & Health: Analyzing stock levels in conjunction with sales velocity provided a snapshot of inventory health. High stock levels for slow-moving items indicated potential holding costs and capital lock-up, while low stock for popular items signaled missed revenue opportunities.
- Customer Value & Loyalty: Analyzing gross amount per customer (or SKU-customer combination) revealed key customer segments or product affinities. This insight can inform targeted marketing campaigns and loyalty programs.
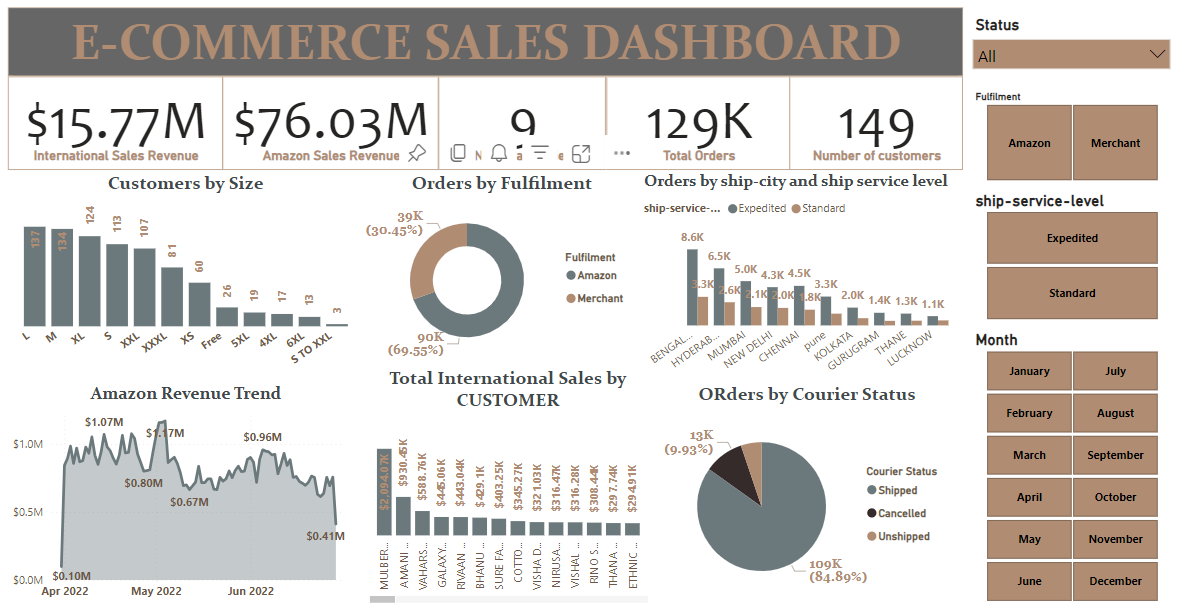
4. Dashboard Design & Key Insights (Based on Visual Analysis)
My project culminated in the creation of intuitive and informative Power BI dashboards, exemplified by the "E-COMMERCE SALES DASHBOARD", designed to provide stakeholders with clear, actionable insights into e-commerce sales profitability.
Dashboard Features and Key Insights from the "E-COMMERCE SALES DASHBOARD":
4.1 Key Performance Indicators (KPIs)
The top section of the dashboard immediately presents critical aggregated KPIs:
- Total International Sales Revenue: `$15.77M` – Provides a high-level overview of global sales performance.
- Amazon Sales Revenue: `$76.03M` – Indicates a significant portion of revenue comes from Amazon, suggesting its importance and potential for further optimization.
- Total Orders: `129K` – A clear measure of overall transaction volume.
- Number of Customers: `149` – This number is notably lower than total orders, which could indicate a high number of repeat customers or a specific B2B model where a few large clients contribute significantly. This is an interesting insight that might warrant further investigation to understand customer acquisition vs. retention.
4.2 Customer and Order Distribution
These visualizations offer insights into customer preferences and operational efficiency:
- Customers by Size (e.g., Apparel Sizes): A bar chart showing `L (157)`, `M (124)`, `XL (113)`, `XXL (107)`, etc. This is crucial for inventory planning and procurement. It clearly indicates the most popular sizes, allowing for optimized stock levels and reduced overstocking of less popular sizes.
- Orders by Fulfillment (Doughnut Chart):
- `Merchant (90K - 69.35%)`
- `Amazon (39K - 30.45%)`
This chart provides a clear breakdown of orders managed by your own merchant fulfillment versus Amazon's fulfillment. The dominant share by 'Merchant' suggests a significant internal logistics operation, which could be an area for cost analysis (comparing internal costs vs. Amazon FBA fees).
- Orders by Ship-City and Ship-Service-Level (Bar Chart): Shows the top cities for orders (Bengal, Hyderabad, Mumbai, New Delhi, Chennai) with breakdowns by `Expedited` and `Standard` shipping. This is vital for logistics and delivery network optimization. For instance, 'Bengal' has the highest number of orders, with a significant portion being 'Expedited', indicating a need for efficient, fast delivery routes to this region.
4.3 Revenue Trends and Customer Value
- Amazon Revenue Trend (Area Chart): Displays Amazon revenue over time (e.g., April 2022 to June 2022). It shows fluctuations, with peaks around `$1.07M` and dips to `$0.41M`. This trend analysis is critical for forecasting, identifying seasonal impacts, and evaluating the effectiveness of marketing campaigns on Amazon. The visible volatility suggests dynamic market conditions or specific sales events.
- Total International Sales by CUSTOMER (Bar Chart): Highlights top customers by total sales, such as `MULBER. (581.76K)`, `AMANI. (576.67K)`, `RIYANI. (480.29K)`, etc. This allows for identification of high-value customers and potential B2B partners. Understanding who your biggest customers are can inform targeted sales strategies and relationship management.
4.4 Courier Status and Interactivity
- Orders by Courier Status (Doughnut Chart):
- `Shipped (13K - 9.93%)`
- `Unshipped (109K - 84.89%)`
This chart presents a critical operational insight. A high percentage of `Unshipped` orders (`84.89%`) compared to `Shipped` (`9.93%`) indicates a significant backlog or a reporting lag. This is an immediate red flag for operations and customer satisfaction, requiring urgent attention to dispatch processes.
- Interactive Filters (Slicers): The dashboard includes intuitive slicers on the right for:
- `Status (All)`: Allows filtering by order status.
- `Fulfillment (Amazon, Merchant)`: Enables comparison of performance by fulfillment method.
- `Ship-service-level (Expedited, Standard)`: Critical for analyzing shipping preferences and costs.
- `Month (January - December)`: Enables time-based trend analysis.
These interactive elements transform static data into a dynamic analytical tool, empowering users to drill down into specific areas of interest and extract customized insights for decision-making.
The dashboard effectively translates complex sales data into a clear, actionable story, supporting strategic planning for an e-commerce business.
5. Technical Approach & Tools
I executed this project following a robust data analysis and business intelligence pipeline:
- Data Acquisition & Ingestion: The comprehensive E-commerce Sales Dataset was provided as the primary data source. I ensured proper ingestion of the raw data into Power BI's data model.
- Data Cleaning & Transformation (Power Query in Power BI): This was a critical phase. I utilized Power Query Editor to:
- Handle Missing Values: Addressed any missing data points by imputation or removal, depending on the column's significance and missingness percentage.
- Correct Data Types: Ensured all columns were correctly typed (e.g., numeric for amounts, date for sale dates) to support accurate calculations.
- Restructure Data: Performed necessary unpivoting or pivoting operations to optimize the data for analysis and visualization within Power BI's tabular model.
- Create Calculated Columns: Derived new columns essential for analysis, such as `Profit` (Gross Amount - Costs - Expenses), `Profit Margin %`, and flags for `Expedited` vs. `Standard` shipping from `ship-service-level` if not already distinct.
- Data Modeling (Power BI Desktop): I established clear and efficient relationships between various tables (if the dataset was split), creating a star or snowflake schema as appropriate. This ensured that filters and slicers applied across the dashboard would function correctly and provide consistent insights.
- DAX (Data Analysis Expressions) Calculations: I wrote complex DAX measures to derive key performance indicators (KPIs) and enable dynamic calculations, including:
- `Total Gross Amount` (e.g., International Sales Revenue, Amazon Sales Revenue)
- `Total Profit`
- `Profit Margin %`
- `Average Rate per Piece`
- `Orders by Fulfillment Type`
- `Orders by Courier Status`
- `Year-over-Year Profit Change`
- `MRP Variance across Stores` (though specific visual not shown on provided dashboard)
- Data Visualization & Dashboarding (Power BI Desktop): The core of the project was designing and building the interactive dashboards, like the "E-COMMERCE SALES DASHBOARD." I selected appropriate visualization types (bar charts for distribution, area charts for trends, doughnut charts for proportions, KPI cards for key metrics) to effectively communicate insights. Emphasis was placed on:
- User-Friendliness: Intuitive layout, clear labels, and logical flow to guide users through the data.
- Interactivity: Implementing slicers (e.g., Status, Fulfillment, Ship-service-level, Month), drill-through capabilities, and tooltips to allow users to explore the data dynamically.
- Aesthetic Design: Choosing a clean, professional color palette and layout to enhance readability and engagement.
- Publishing & Sharing (Power BI Service): The final interactive reports were published to the Power BI Service, enabling secure sharing and access for stakeholders.
6. Impact & Business Value
This E-commerce Sales Profitability Analysis project delivers significant value to e-commerce businesses, digital marketers, and operations managers by providing the data-driven insights needed for strategic decision-making:
- Optimized Profitability: By clearly identifying the most profitable sales channels and product categories, and analyzing fulfillment costs, businesses can focus resources where they yield the highest returns, directly impacting their bottom line. The "Orders by Fulfillment" breakdown helps in this.
- Enhanced Operational Efficiency: Granular insights into fulfillment methods (Amazon vs. Merchant) and shipping service levels allow for informed decisions on delivery options, potentially leading to significant cost savings and streamlined logistics. The "Orders by ship-city and ship-service-level" chart is directly valuable here. The alarming "Orders by Courier Status" chart highlights an immediate operational bottleneck that needs urgent attention to improve delivery times and customer satisfaction.
- Smarter Pricing Strategies: The comparative analysis of MRPs across various platforms (supported by the underlying data) empowers businesses to set competitive yet profitable prices, improving market positioning and revenue generation.
- Improved Inventory Management: Understanding customer preferences by size from "Customers by Size" helps minimize carrying costs associated with excess inventory and prevent lost sales due to stockouts, leading to a healthier supply chain.
- Effective Marketing & Promotions: Insights into customer purchasing patterns and the true profitability of promotional offers enable the creation of more targeted and financially viable marketing campaigns, maximizing ROI on advertising spend. The "Total International Sales by CUSTOMER" helps identify key targets for loyalty programs.
- Data-Driven Decision Making: The interactive Power BI dashboards, as showcased, transform complex data into easily digestible visuals, enabling stakeholders to move beyond intuition and make decisions based on solid evidence, fostering a culture of continuous improvement.
- Identification of Unseen Losses: By thoroughly examining the P&L and cost components, businesses can uncover hidden expenses or inefficiencies, leading to targeted cost-cutting measures and improved financial health. The analysis of "Amazon Revenue Trend" combined with other sales figures can help identify periods of underperformance.
7. Conclusion
This E-commerce Sales Profitability Analysis project successfully harnessed the power of Power BI to transform raw sales data into a comprehensive and interactive tool for strategic business optimization. By meticulously analyzing sales trends, channel profitability, pricing dynamics, and operational efficiency (as visually represented in the dashboard), I was able to generate actionable insights that empower e-commerce businesses to navigate the complexities of today's market. The resulting dashboards serve as a vital resource for making informed decisions, ultimately driving enhanced profitability, operational efficiency, and sustained growth in the dynamic e-commerce sector.