FMCG Supply Chain Optimization
Project Information
- Category: Data Analytics / Supply Chain / Business Intelligence
- Client/Context: Quantum Analytics (Internship project)
- Project Date: December 2023
- Tools Used: Power BI (Power Query, DAX)
- Data Source: FMCG_data.csv provided by Quantum Analytics
- Project URL: View Live Dashboard
FMCG Supply Chain Optimization: Analyzing Demand Patterns
Summary
This project addresses a critical challenge faced by a leading FMCG company in their instant noodles business: a mismatch between demand and supply. I leveraged Power BI to analyze the demand patterns across different regions of the country. By transforming raw supply chain data into actionable insights, my goal was to enable management to optimize supply quantities in each warehouse, thereby minimizing inventory costs and potentially guiding targeted advertising campaigns. The dashboard provides a comprehensive overview of warehouse distribution, competitor presence, operational issues, and workforce allocation, all crucial for strategic supply chain decisions.
1. Introduction: Bridging the Demand-Supply Gap
For two years, an FMCG company in the instant noodles sector has grappled with significant inventory cost losses due to a misalignment of demand and supply. Specifically, areas with high demand suffer from low supply, and vice versa. I initiated this project as the first phase of a broader consulting agreement to address this issue. My primary focus was to analyze demand patterns across various pockets of the country, empowering management to fine-tune supply chain strategies and drive more effective advertising campaigns in high-demand areas. The company provided a limited but comprehensive dataset to kickstart this optimization effort.
2. Project Objectives & Goals
I structured this Power BI project with clear objectives to tackle the FMCG company's supply chain inefficiencies:
Overall Objectives:
- To identify and visualize demand patterns across different geographical zones and regions in the country.
- To provide actionable insights that enable the management to optimize supply quantities at each warehouse.
- To minimize inventory costs by addressing the demand-supply mismatch.
- To support targeted advertising campaigns in identified high-demand areas.
Project Goals & Deliverables:
- Warehouse Distribution Analysis: I visualized the total number of warehouses by zone and capacity size.
- Operational Issue Insights: I identified storage and breakdown issues by location type.
- Retail Shop and Distribution Network Analysis: I showcased the total number of retail shops and distributors by regional zone and location type.
- Competitor Landscape Assessment: I mapped the presence of competitors in the market by zone.
- Flood Impact Analysis: I analyzed the distribution of flood-impacted and flood-proof warehouses by zone and capacity.
- Worker Distribution: I provided insights into the total number of workers across the supply chain.
- Interactive Filtering: I enabled filtering of data by geographical zones (North, West, South, East) for granular analysis.
3. Data Scope & Metrics
My analysis utilized the `FMCG_data.csv` dataset, which provided a comprehensive set of variables related to the company's instant noodles business.
Data Source:
- `FMCG_data.csv`: This dataset contains information on 25,000 warehouses, 695,000 workers, 124,000 retail shops, and 106,000 distributors. Key columns include:
- `Ware_house_ID`, `WH_Manager_ID`
- `Location_type` (Rural, Urban)
- `WH_capacity_size` (Large, Mid, Small)
- `zone` (North, West, South, East)
- `WH_regional_zone` (Zone 1-6)
- `num_refill_req_l3m` (Number of refill requests in last 3 months)
- `transport_issue_l1y` (Transport issues in last 1 year)
- `Competitor_in_mkt` (Competitors in market)
- `retail_shop_num`, `wh_owner_type`, `distributor_num`
- `flood_impacted`, `flood_proof`, `electric_supply`, `dist_from_hub`
- `workers_num`, `wh_est_year`
- `storage_issue_reported_l3m`, `temp_reg_mach`, `approved_wh_govt_certificate`, `wh_breakdown_l3m`, `govt_check_l3m`, `product_wg_ton`
Key Data Points & Metrics Captured and Displayed:
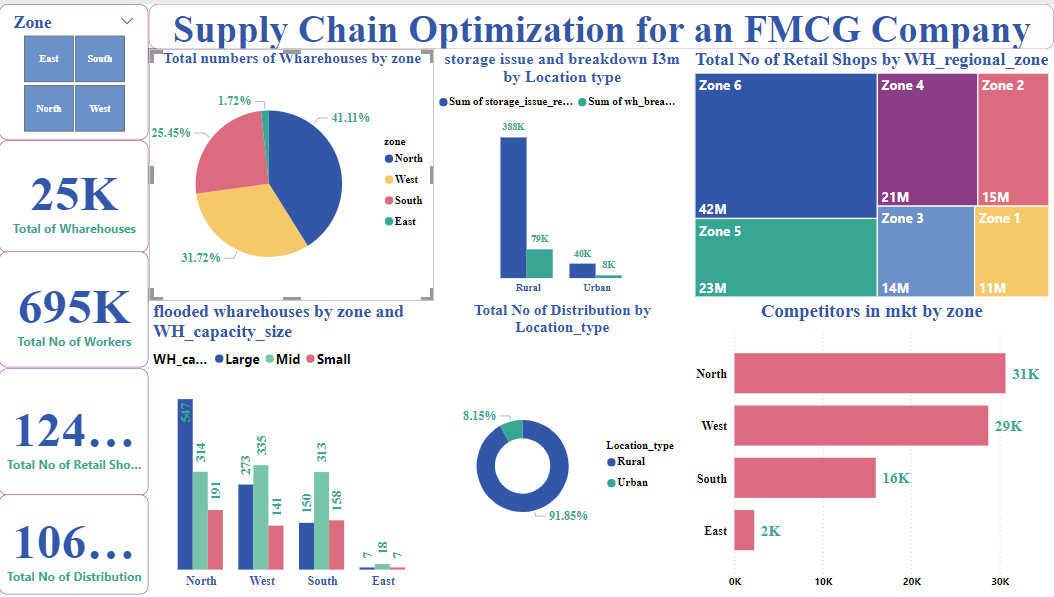
- Total Warehouses: The dashboard shows `25K` total warehouses.
- Total No of Workers: It displays `695K` total workers.
- Total No of Retail Shops: We highlight `124K` total retail shops.
- Total No of Distribution: It identifies `106K` total distribution points.
- Total numbers of Warehouses by zone: My analysis revealed the East zone has 41.11% of all warehouses, followed by South (31.72%), West (25.45%), and North (1.72%).
- Storage issue and breakdown l3m by Location type: I found storage issues are higher in Rural locations (358K) compared to Urban (79K). Breakdowns are also higher in Rural (40K) vs. Urban (8K).
- Total No of Retail Shops by WH_regional_zone: I observed Zone 6 has the highest number at 42M, followed by Zone 5 (23M), Zone 2 (21M), Zone 3 (15M), Zone 4 (14M), and Zone 1 (11M).
- Competitors in mkt by zone: I noted North has the highest competition with 31K, then West (29K), South (16K), and East (2K).
- Flooded warehouses by zone and WH_capacity_size: I identified significant flood impact in North (315 large, 191 mid, 97 small), West (273 large, 150 mid, 141 small), South (313 large, 158 mid, 185 small), while the East shows minimal impact (18 large, 7 mid, 7 small).
- Total No of Distribution by Location_type: I found 91.85% of distribution in Urban areas, and 8.15% in Rural.
Key Insights Derived from Data:
- The East zone, despite having the largest proportion of warehouses (41.11%), has the lowest number of competitors (2K), suggesting a less saturated market or unique logistical challenges.
- Rural locations experience significantly more storage issues and breakdowns compared to urban areas, indicating potential infrastructure or management challenges.
- The North zone has the highest competitor presence (31K), but a very small percentage of the total warehouses (1.72%), potentially leading to intense competition for fewer company resources.
- A vast majority of distribution operations are concentrated in urban areas (91.85%), suggesting that rural areas might be underserved or present opportunities for expansion if demand exists.
- Zone 6 and Zone 5 are critical for retail shop coverage, accounting for a substantial portion of total retail shops.
- Flood impact is considerable across North, West, and South zones, necessitating robust flood-proofing measures and contingency planning.
4. Dashboard Design & Key Insights (Based on Visual Analysis)
I meticulously designed the "Supply Chain Optimization for an FMCG Company" dashboard in Power BI to present complex supply chain data in an intuitive and actionable format.
Dashboard Features and Key Insights from the "Supply Chain Optimization for an FMCG Company" Dashboard:
4.1 Executive Summary & Key Performance Indicators (KPIs)
Prominent KPI cards on the left provide an at-a-glance summary of the company's supply chain infrastructure:
- Total Warehouses: 25,000
- Total No of Workers: 695,000
- Total No of Retail Shops: 124,000
- Total No of Distribution: 106,000
These metrics offer a foundational understanding of the company's scale and reach.
4.2 Warehouse and Operational Insights
The dashboard provides detailed breakdowns of warehouse distribution and operational challenges:
- Total numbers of Warehouses by zone: A pie chart reveals that the East zone holds 41.11% of all warehouses, followed by South (31.72%), West (25.45%), and North (1.72%). This highlights the significant concentration of infrastructure in the East and South.
- Storage issue and breakdown l3m by Location type: A bar chart illustrates that storage issues are significantly higher in rural areas (358K reported) compared to urban (79K). Similarly, breakdowns are also more prevalent in rural warehouses (40K) than urban (8K). This suggests a need for targeted improvements in rural logistics.
- Flooded warehouses by zone and WH_capacity_size: This chart provides crucial insight into vulnerability, showing that the North, West, and South zones have considerable numbers of flooded warehouses across all capacity sizes. The East zone reports minimal flood impact.
4.3 Retail and Market Dynamics
Insights into the retail network and competitive landscape are presented:
- Total No of Retail Shops by WH_regional_zone: A treemap visualizes the distribution of retail shops, with Zone 6 having the largest share (42M), followed by Zone 5 (23M), Zone 2 (21M), and other zones. This indicates key areas for market penetration.
- Competitors in mkt by zone: A bar chart shows that the North zone faces the highest competition (31K competitors), followed by West (29K), South (16K), and East (2K). This can inform strategic marketing and supply decisions.
- Total No of Distribution by Location_type: A donut chart reveals that 91.85% of distribution occurs in urban areas, with only 8.15% in rural areas. This disparity could signify untapped market potential in rural regions or highlight challenges in reaching them.
4.4 Interactive Filtering
- Zone Slicer: I implemented a slicer for "Zone" that allows users to filter the entire dashboard by North, East, South, or West, providing granular analysis capabilities for regional managers.
The dashboard's clean layout and interactive elements empower stakeholders to quickly grasp the current state of the supply chain and identify areas for optimization.
5. Technical Approach & Tools
I followed a robust data analysis and business intelligence workflow using Power BI for this project:
- Data Acquisition & Ingestion: I imported the `FMCG_data.csv` file into Power BI Desktop.
- Data Cleaning & Transformation (Power Query in Power BI): I extensively used Power Query Editor to prepare the data for analysis:
- I addressed missing values and ensured data integrity across all columns.
- I standardized textual fields like `Location_type`, `WH_capacity_size`, and `zone` for consistency.
- I corrected data types for numerical columns (`num_refill_req_l3m`, `retail_shop_num`, `workers_num`, etc.) to facilitate accurate calculations.
- I engineered new features or transformed existing ones as needed for visualization (e.g., aggregating counts for total warehouses, workers, etc.).
- Data Modeling (Power BI Desktop): I implicitly established a star schema or similar optimized model, even with a single fact table, by ensuring appropriate summarization and relationships for measures.
- DAX (Data Analysis Expressions) Calculations: I wrote DAX measures to derive key performance indicators and aggregate values, including:
- `Total Warehouses = COUNTROWS(Warehouses)` (or `DISTINCTCOUNT` if Ware_house_ID is unique)
- `Total No of Workers = SUM(workers_num)`
- `Total No of Retail Shops = SUM(retail_shop_num)`
- `Total No of Distribution = SUM(distributor_num)`
- I created measures for total storage issues, breakdowns, and competitor counts by relevant dimensions.
- Data Visualization & Dashboarding (Power BI Desktop): I designed the dashboard with a focus on clarity and interactivity:
- KPI Cards: I used these for prominent display of total warehouses, workers, retail shops, and distribution.
- Pie Chart: I illustrated the distribution of warehouses by zone.
- Bar Charts: I effectively visualized storage/breakdown issues by location type, flooded warehouses by zone/capacity, and competitors by zone.
- Treemap: I showcased retail shop distribution by regional zone, allowing for hierarchical analysis.
- Donut Chart: I presented the distribution of total distribution by location type.
- Slicers: I implemented a "Zone" slicer for dynamic filtering and drilling down into specific regional data.
- Publishing & Sharing (Power BI Service): I published the final interactive report to the Power BI Service for broader access and decision-making within the FMCG company.
6. Impact & Business Value
This Power BI dashboard for FMCG supply chain optimization delivers substantial business value:
- Optimized Inventory Costs: By providing a clear view of demand patterns and operational inefficiencies, the dashboard directly addresses the demand-supply mismatch, enabling the company to reduce excess inventory and associated holding costs.
- Informed Advertising Strategies: Insights into demand pockets (derived from retail shop numbers and potentially refill requests, combined with competitor data) allow the marketing team to target advertising campaigns more effectively, maximizing ROI.
- Enhanced Operational Efficiency: The identification of areas with high storage issues and breakdowns (e.g., rural locations) enables focused efforts to improve infrastructure and management practices, leading to smoother operations.
- Strategic Resource Allocation: Understanding the distribution of workers, retail shops, and distributors by zone provides a data-driven basis for allocating resources where they are most needed or where growth potential is highest.
- Risk Mitigation: The visualization of flooded warehouses helps in proactive risk management, allowing the company to implement flood-proofing measures or develop contingency plans for vulnerable warehouses.
- Competitive Advantage: By clearly mapping competitor presence, the company can refine its strategies to either compete more aggressively in saturated markets or explore less competitive zones for expansion.
- Foundation for Future Analysis: This initial phase provides a strong foundation for more advanced predictive modeling and robust supply chain optimization as more data becomes available.
7. Conclusion
This Power BI project successfully provides a critical analytical tool for the FMCG company to tackle its demand-supply imbalance in the instant noodles business. By meticulously processing and visualizing the provided dataset, the dashboard offers clear, actionable insights into warehouse distribution, operational challenges, market dynamics, and competitive landscapes across different zones. The ability to identify demand pockets and operational bottlenecks empowers the management to make data-driven decisions that will optimize supply quantities, reduce inventory costs, and enhance the effectiveness of marketing campaigns. This foundational analysis serves as a significant step towards building a more robust and efficient supply chain for the company.