Health Insurance Coverage Analysis
Project Information
- Category: Healthcare Analytics / Policy Analysis / Data Visualization
- Client: Quantum Analytics (Internship Project)
- Project Date: December 2023
- Tools Used: Tableau, Microsoft Excel
- Data Source: US Department of Health and Human Services, US Census Bureau
- Project URL: View on Tableau Public
Health Insurance Coverage: Analyzing the Impact of the Affordable Care Act
Summary
This project involved a detailed examination of Health Insurance Coverage and the Affordable Care Act's (ACA) significant influence. The primary goal was to analyze and visualize health insurance coverage rates across US states, specifically examining changes in uninsured populations before and after the ACA's implementation. This involved dissecting data on employer-sponsored plans, marketplace enrollment, and public programs like Medicare and Medicaid. Through this project, I aimed to quantify the ACA's effect on insurance coverage, identify states with significant improvements, and explore the underlying policy choices influencing these changes.
1. Introduction: The Affordable Care Act and Healthcare Access
The Affordable Care Act (ACA), enacted in 2010, marked a significant shift in US healthcare policy, aiming to expand health insurance coverage, control healthcare costs, and improve preventive care access. Understanding its impact is crucial for policymakers, healthcare providers, and the public. This project, conducted as part of my internship at Quantum Analytics, delves into a rich dataset providing health insurance coverage statistics for each US state and the nation. My objective was to leverage data analysis and visualization to illustrate how the ACA changed the landscape of health insurance coverage, providing a clear, data-driven narrative of its effects.
A central inquiry for this project was: "How has the Affordable Care Act changed the rate of citizens with health insurance coverage, and which states observed the greatest decline in their uninsured rate?" Furthermore, I explored the role of Medicaid expansion and health insurance marketplaces in these state-level changes.
2. Project Objectives & Goals
My work on this project was guided by clear objectives to deliver impactful insights into healthcare policy:
Overall Objectives:
- To quantify the change in uninsured rates nationwide and by state before and after the ACA's implementation.
- To identify states that experienced the most significant reductions in their uninsured populations.
- To analyze the relationship between state-level policy decisions (Medicaid expansion, marketplace implementation) and changes in coverage.
- To visualize enrollment trends across different types of health insurance coverage (employer, marketplace, Medicare, Medicaid).
Project Goals & Deliverables:
- National Uninsured Rate Trend: A time-series visualization showing the national uninsured rate before and after the ACA's enactment, highlighting the overall impact.
- State-Level Uninsured Rate Map: A choropleth map of the US, illustrating uninsured rates by state and allowing for comparison of changes over time.
- Top Performing States Analysis: Detailed charts identifying the states with the greatest percentage or absolute decline in uninsured rates.
- Policy Correlation Visualization: Visualizations (e.g., scatter plots or grouped bar charts) comparing uninsured rate changes with state-level Medicaid expansion status and presence of state-run marketplaces.
- Coverage Type Distribution: Breakdown of insurance coverage by type (employer, marketplace, Medicare, Medicaid) before and after the ACA, showing shifts in enrollment.
- Interactive Dashboard: A user-friendly Tableau dashboard enabling users to filter by state, year, and coverage type to explore specific trends and policy implications.
3. Data Scope & Metrics
The project utilized a comprehensive dataset on health insurance coverage, compiled from reputable sources such as the US Department of Health and Human Services and the US Census Bureau. Key variables included:
- Uninsured Rates (Before and After ACA): Percentage of population without health insurance.
- Individuals Covered by Employer Plans: Estimates of those covered through employment-based insurance.
- Individuals Covered by Marketplace Plans: Estimates of enrollment through health insurance marketplaces established by the ACA.
- Medicare Enrollment: Number of individuals enrolled in Medicare (primarily for seniors and certain disabled individuals).
- Medicaid Enrollment: Number of individuals enrolled in Medicaid (primarily for low-income individuals and families).
- State-level indicators: Data points potentially including whether a state expanded Medicaid or established a state-run marketplace.
Key Insights Derived from Data:
- Significant National Decline in Uninsured Rate: Post-ACA, the nationwide uninsured rate observed a notable decline, demonstrating the law's effectiveness in expanding coverage. This was particularly evident in the years immediately following 2014, when key provisions of the ACA went into effect.
- Medicaid Expansion States Saw Largest Gains: States that chose to expand their Medicaid programs experienced, on average, the most substantial drops in their uninsured rates, indicating Medicaid's critical role in reaching previously uncovered low-income populations.
- Marketplace Impact: States with active health insurance marketplaces also showed significant improvements in coverage, particularly among individuals not eligible for Medicaid but who could qualify for premium subsidies through the marketplace. The interplay between state-run marketplaces and uninsured rates was a clear pattern.
- Regional Disparities Persist: Despite overall gains, significant regional disparities in uninsured rates remained, largely correlating with states' decisions on Medicaid expansion. Southern states, many of which did not expand Medicaid, generally maintained higher uninsured rates.
- Shift in Coverage Mix: The data revealed a shift in the composition of health insurance coverage, with an increase in Medicaid and marketplace enrollments, while employer-sponsored coverage remained relatively stable or saw minor fluctuations.
- Prediction for the Next Five Years: Based on current trends and the political landscape, it is predicted that the nationwide uninsured rate may plateau or experience slight fluctuations. Further significant declines would likely depend on additional states adopting Medicaid expansion or new federal policies aimed at expanding coverage or reducing costs. Without major policy changes, the rate is unlikely to drop dramatically, and could even tick up if policies restricting access are enacted.
4. Dashboard Design & Key Insights
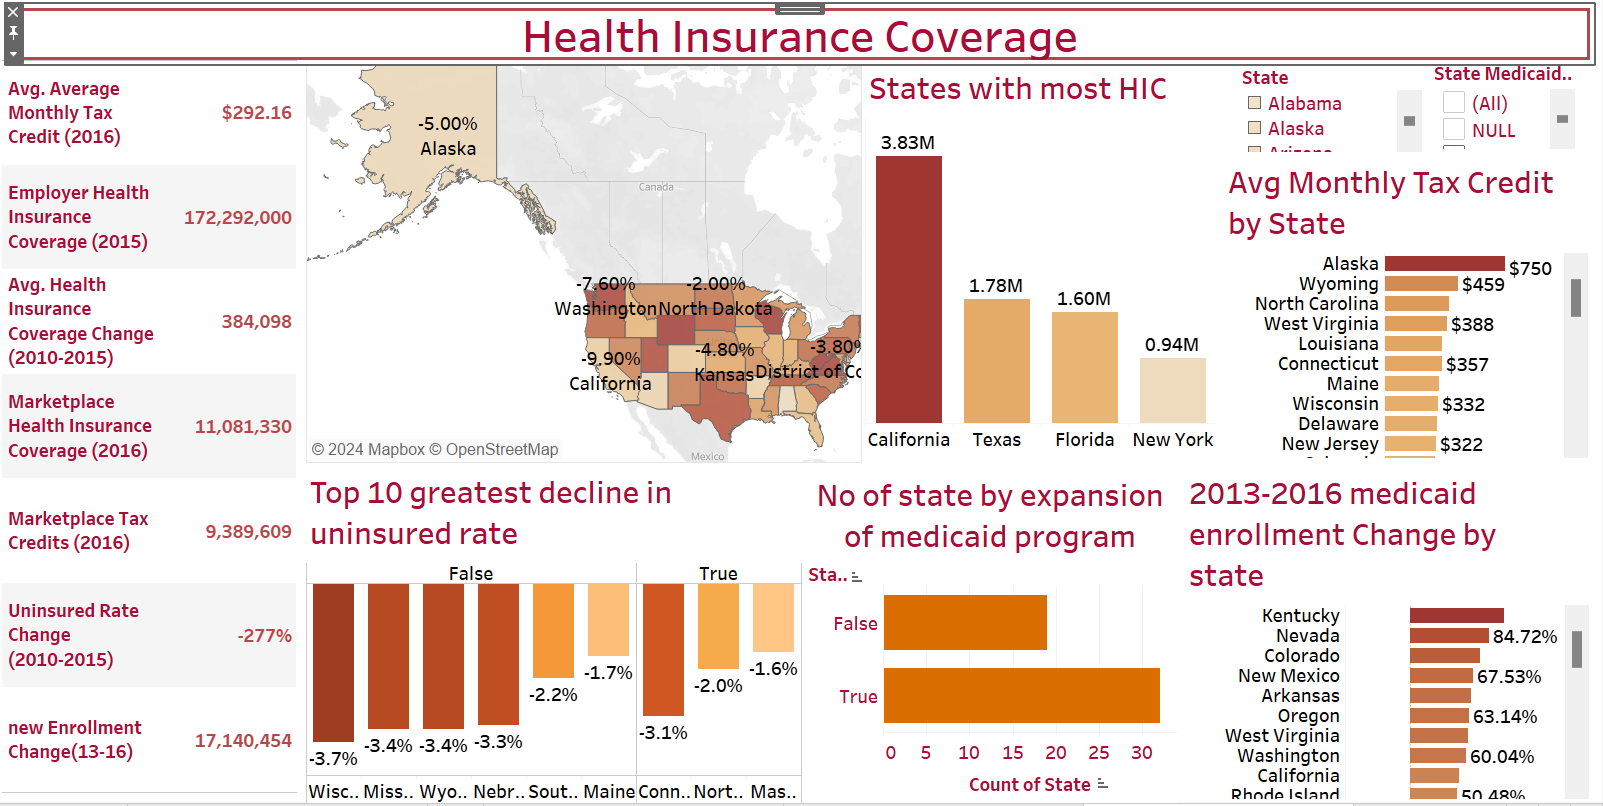
My Tableau dashboard was meticulously designed to illustrate the complex dynamics of health insurance coverage changes post-ACA, offering actionable insights for policy analysis. Key components included:
Dashboard Features and Insights:
- Overall Uninsured Rate Trend: A dynamic line chart showing the national uninsured rate from pre-ACA years through the latest available data, allowing users to visually track the impact.
- State-Level Uninsured Rate Comparison Map: An interactive US map colored by uninsured rate, with a toggle or slider to compare "before ACA" and "after ACA" rates, immediately highlighting states with the greatest changes.
- Top/Bottom States by Uninsured Rate Change: Bar charts ranking states by the absolute or percentage change in their uninsured rates, making it easy to identify high-impact areas.
- Policy Decision Overlay: A visualization (e.g., a custom shape map or scatter plot with colored markers) depicting which states expanded Medicaid and/or implemented state-run marketplaces, overlaid with their uninsured rate changes to show correlation.
- Coverage Type Stacked Bar Chart: A stacked bar chart showing the breakdown of insurance types (Employer, Marketplace, Medicaid, Medicare) by year and state, illustrating how the mix of coverage has evolved.
- Interactive Filters: Filters for year ranges, specific states, and coverage types to allow for granular exploration of data and customized analysis.
- Projected Trends (Conceptual): While complex predictive models are outside Tableau's direct scope, the dashboard could include historical trend lines to visually suggest future trajectory or call out the "prediction for the next five years" as a textual insight.
The dashboard's interactivity empowered users to validate hypotheses about policy impacts and observe how specific state-level decisions translated into changes in health insurance access.
5. Technical Approach & Tools
This project followed a standard data analysis and visualization pipeline:
- Data Acquisition: The health insurance coverage dataset was compiled from authoritative sources like the US Department of Health and Human Services and the US Census Bureau, provided by Quantum Analytics.
- Data Cleaning & Preprocessing (Microsoft Excel): The raw data was meticulously prepared in Microsoft Excel. This involved standardizing state names, ensuring consistent date formats, handling any potential data entry errors or inconsistencies, and preparing the data for direct import into Tableau. Calculated fields for percentage change or rate differences were also prepared or planned for Tableau.
- Exploratory Data Analysis (EDA): Initial data profiling and summary statistics were generated to understand the distribution of uninsured rates and enrollment figures across different states and over time. This helped in identifying key periods of change and potential outliers.
- Data Visualization & Dashboarding (Tableau): The core analytical and visualization work was performed using Tableau Desktop. This included:
- Connecting to the cleaned data.
- Creating various visualizations such as line charts for trends, choropleth maps for geographic distribution, and bar charts for comparisons.
- Utilizing parameters and calculated fields to enable dynamic analysis, such as toggling between different years or metrics.
- Designing a cohesive and intuitive dashboard layout that guides the user through the key insights related to ACA's impact.
- Publishing the final interactive dashboard to Tableau Public for broad accessibility.
6. Impact & Business Value
This Health Insurance Coverage project offers significant value, particularly in the realm of public policy analysis, healthcare advocacy, and research:
- Informing Policy Decisions: Provides clear, data-driven evidence of the ACA's impact, helping policymakers understand the effectiveness of different approaches (e.g., Medicaid expansion) in reducing uninsured rates.
- Supporting Healthcare Advocacy: Organizations working to expand healthcare access can use these insights to highlight successful strategies and advocate for continued or expanded coverage initiatives.
- Public Awareness and Education: The visualizations can make complex healthcare policy data accessible to a broader audience, fostering greater understanding of health insurance changes.
- Benchmarking for States: States can benchmark their coverage improvements against others, learning from successful policies and identifying areas where more efforts are needed.
- Resource Allocation: Healthcare providers and public health departments can better anticipate shifts in insured populations, aiding in resource planning and service delivery.
- Foundation for Future Research: The analysis serves as a foundation for deeper dives into specific demographic groups, health outcomes, or cost implications related to changes in coverage.
7. Conclusion
My Health Insurance Coverage project at Quantum Analytics successfully illuminated the profound impact of the Affordable Care Act on health insurance access across the United States. Through detailed analysis and compelling Tableau visualizations, I was able to demonstrate the nationwide decline in uninsured rates post-ACA, highlight the leading role of Medicaid expansion in this improvement, and identify states that observed the greatest progress. This project not only honed my skills in healthcare data analytics and policy-driven visualization but also provided a clear answer to how major legislation can reshape a nation's healthcare landscape. My experience solidified my ability to extract, analyze, and present complex data to inform critical discussions on public health policy during my internship.