IMDB Movie Data Analysis
Project Information
- Category: Entertainment Analytics / Data Visualization
- Client: Quantum Analytics (Internship Project)
- Project Date: Sept 2023
- Tools Used: Tableau, Microsoft Excel
- Data Source: IMDB (via publicly available dataset)
- Project URL: View on Tableau Public
IMDB Movie Data Analysis: Uncovering Trends in the Film Industry
Summary
As one of my initial projects during my internship at Quantum Analytics, I undertook an analysis of IMDB movie data using Tableau. The objective was to explore the vast landscape of the film industry, identifying key trends in movie production, box office performance, and audience reception. This project involved dissecting historical movie data to understand the most successful genres, the impact of directors and actors, and the relationship between budget and revenue. Through intuitive visualizations, I aimed to provide insights that could inform production strategies, marketing efforts, and general understanding of what makes a movie a success.
1. Introduction: The Data-Driven Story of Cinema
The entertainment industry, particularly cinema, generates immense amounts of data, from box office receipts to audience ratings. This data holds valuable insights into consumer preferences, market dynamics, and the elements contributing to a film's success. This project, conducted as part of my internship at Quantum Analytics, focused on exploring a dataset of IMDB movie information. My aim was to transform raw movie statistics into a compelling narrative, revealing the underlying patterns and trends that shape the global film landscape. This foundational project solidified my skills in data exploration and visualization within a rich, real-world context.
2. Project Objectives & Goals
My work on this project was guided by clear objectives to extract meaningful insights from movie data:
Overall Objectives:
- To analyze the overall trends in movie production volume, budget, and revenue over time.
- To identify the most popular and profitable movie genres.
- To assess the correlation between movie budget, revenue, and audience/critic ratings.
- To evaluate the consistent performance of key directors and actors in terms of box office success and critical acclaim.
Project Goals & Deliverables:
- Movie Production and Revenue Trends: Visualizations showing the number of movies produced and total/average box office revenue per year, highlighting growth or decline in the industry.
- Genre Performance Analysis: Bar charts or treemaps illustrating the most profitable genres, highest-rated genres, and genres with the most films produced.
- Director and Actor Impact: Rankings and comparisons of directors and lead actors by their average movie revenue, number of successful films, or average IMDB rating.
- Budget vs. Revenue & Rating Correlation: Scatter plots examining the relationship between movie budget and its worldwide gross revenue, as well as budget and IMDB ratings, helping to understand investment efficiency.
- Rating Distribution: Histograms or density plots showing the distribution of IMDB ratings across all movies, indicating overall audience satisfaction.
- Interactive Dashboard: A user-friendly Tableau dashboard allowing filtering by genre, year, director, or actor to enable deep dives into specific film segments.
3. Data Scope & Metrics (Inferred)
This project utilized an IMDB movie dataset, typically compiled from publicly available sources. While specific column names were not provided, common attributes in such datasets, and thus likely included in this analysis, are:
- Movie Title: The name of the film.
- Release Year: The year the movie was released.
- Genre(s): Categories the movie belongs to (e.g., Action, Drama, Comedy).
- Director: The film's director.
- Cast: Key actors in the film.
- Budget: The production budget of the movie (in USD).
- Revenue: Worldwide gross box office revenue (in USD).
- IMDB Rating / Score: The average rating given by IMDB users.
- Number of Votes: The total count of votes contributing to the IMDB rating.
- Runtime: The length of the movie in minutes.
- Production Company: The studio or company that produced the film.
Key Insights Derived from Data:
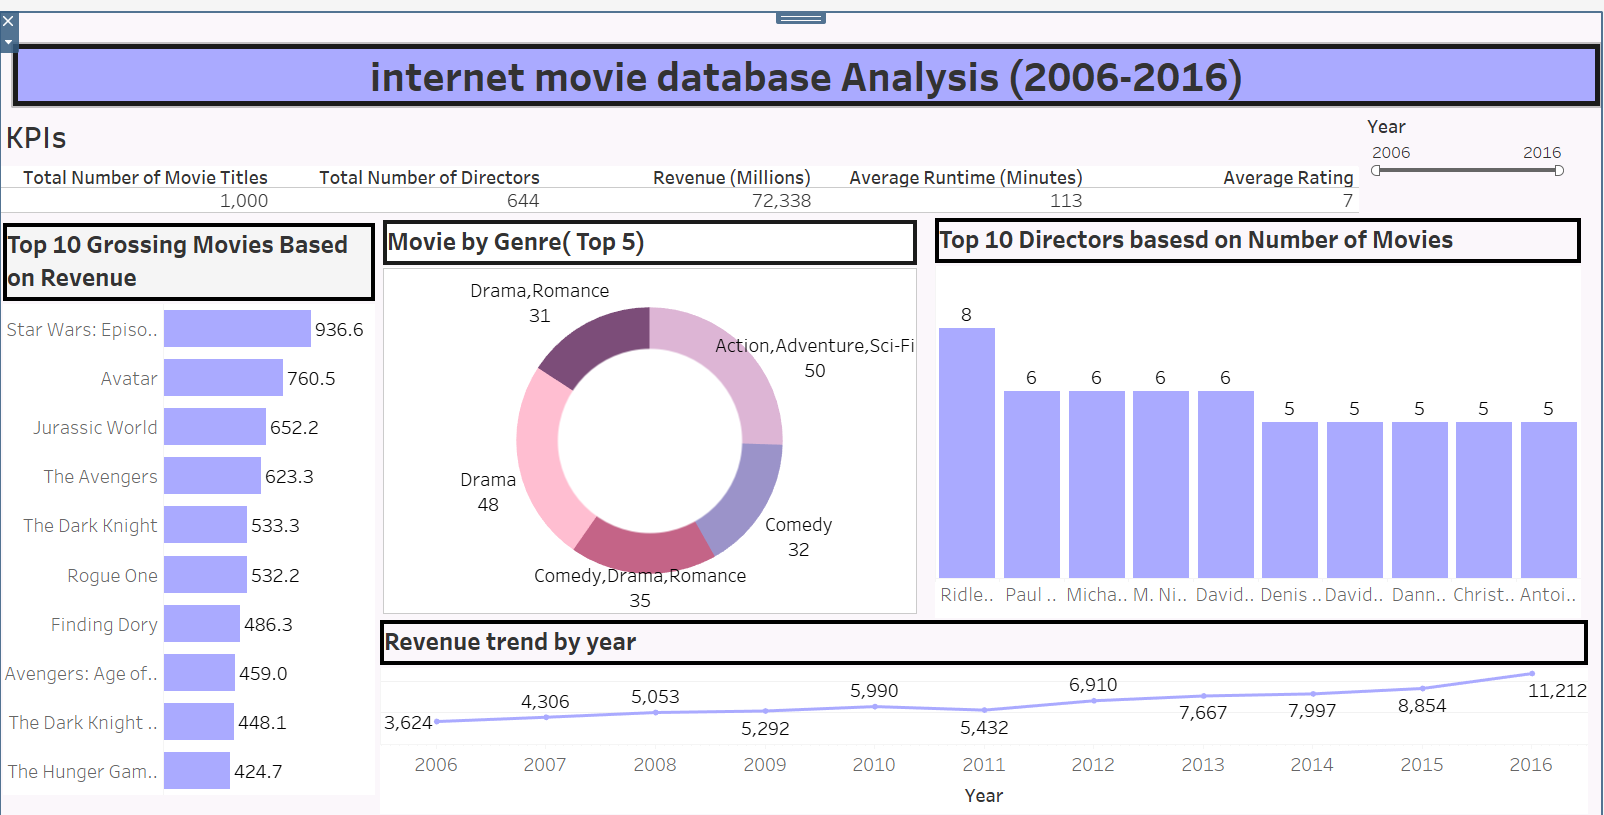
- Consistent Growth in Production and Revenue: The analysis revealed a general upward trend in both the number of movies produced and global box office revenue over the years, indicating a thriving and expanding film industry.
- Action and Adventure Dominate Box Office: Genres like 'Action', 'Adventure', and 'Sci-Fi' consistently generated the highest revenues, underscoring their broad appeal and often larger production scales. However, 'Drama' and 'Comedy' often had higher average ratings for their budget.
- Budget-Revenue Relationship Not Always Linear: While higher budgets generally correlated with higher revenues, there were notable instances of low-budget films achieving massive success and high-budget films underperforming, highlighting the unpredictable nature of audience reception.
- "Critic-Proof" Directors/Actors: Certain directors and lead actors demonstrated a remarkable ability to consistently deliver high-grossing films, irrespective of critical reception, suggesting strong individual brand power and audience loyalty.
- Rating Distribution Skew: The distribution of IMDB ratings often showed a left-skew, with a higher concentration of movies falling in the mid-to-high rating range (e.g., 6.5-7.5), suggesting a general positive audience reception for most films.
- Emergence of Niche but Highly Rated Genres: While not always top earners, certain niche genres or independent films consistently received very high IMDB ratings, indicating strong critical or dedicated fan appreciation.
4. Dashboard Design & Key Insights
My Tableau dashboard was designed to provide a comprehensive and interactive overview of the IMDB movie data, enabling users to explore trends and drill down into specific areas of interest. Key components included:
Dashboard Features and Insights:
- Overall Industry Trends: A line chart displaying the total number of movies released and total revenue per year, providing a macro view of the industry's evolution.
- Genre Performance Dashboard: Dedicated section with bar charts for total revenue and average rating per genre, with filters to select specific genres.
- Director/Actor Spotlight: Tables or bar charts ranking directors and lead actors by cumulative revenue or average IMDB rating, allowing for quick identification of top talent.
- Budget-Revenue-Rating Scatter Plot: An interactive scatter plot with budget on the X-axis, revenue on the Y-axis, and data points colored by IMDB rating, to visually explore complex relationships.
- Rating Distribution Histogram: A histogram illustrating the frequency of movies across different IMDB rating bins, giving insight into audience satisfaction.
- Interactive Filters: Comprehensive filters for release year, genre, director, lead actor, and budget/revenue ranges, enabling granular data exploration.
- Movie Details on Hover: Tooltips providing detailed information about individual movies when hovering over data points on charts.
The dashboard's interactive nature allowed for dynamic exploration, empowering users to answer specific questions about movie success factors and industry shifts.
5. Technical Approach & Tools
This project followed a standard data analysis and visualization pipeline:
- Data Acquisition: The IMDB movie dataset was obtained from a publicly available source, as provided by Quantum Analytics.
- Data Cleaning & Preprocessing (Microsoft Excel): This crucial phase involved cleaning and transforming the raw data. This included handling missing values (e.g., for budget or revenue), standardizing genre spellings, parsing lists of directors/actors (if required), and ensuring consistent data types for numerical and date fields. Data was structured optimally for Tableau's use.
- Exploratory Data Analysis (EDA): Initial statistical summaries and basic pivot table analyses were conducted in Excel to understand data distributions, identify potential outliers, and formulate preliminary hypotheses about movie performance factors.
- Data Visualization & Dashboarding (Tableau): The core of the project was built using Tableau Desktop. This involved:
- Connecting to the cleaned dataset.
- Creating various sheets using diverse chart types (e.g., line charts for time series, bar charts for comparisons, scatter plots for correlations).
- Developing calculated fields for metrics like "Profit" (Revenue - Budget), or categorizing ratings/budgets into bins.
- Assembling multiple sheets into a cohesive, interactive dashboard, ensuring logical flow and user-friendliness.
- Publishing the final dashboard to Tableau Public for easy access and sharing.
6. Impact & Business Value
This IMDB Movie Data Analysis project offers valuable insights for various stakeholders within and outside the entertainment industry:
- For Movie Studios & Producers: Provides data-driven insights for strategic decision-making regarding genre focus, budget allocation, talent selection, and release timing to maximize box office potential and critical acclaim.
- For Investors: Helps in identifying trends and potential risks/rewards associated with investing in film projects by understanding the historical performance of different film attributes.
- For Marketing Teams: Informs targeted marketing campaigns by understanding audience preferences for genres, actors, and directors.
- For Film Enthusiasts & Critics: Offers a deeper, quantitative understanding of film trends, the impact of various elements on a movie's reception, and the evolution of cinema over time.
- Demonstrates Analytical Acumen: Showcases the ability to extract meaningful patterns from large, complex datasets and present them in an understandable and actionable format.
7. Conclusion
My IMDB Movie Data Analysis project at Quantum Analytics was a fascinating journey into the world of cinema through data. By meticulously cleaning, analyzing, and visualizing a comprehensive movie dataset using Tableau, I was able to uncover significant trends in genre popularity, revenue generation, and the impact of creative talent. This project not only demonstrated my proficiency in handling real-world datasets and creating impactful dashboards but also provided valuable insights into the dynamics of the entertainment industry. It was a foundational experience that solidified my skills in data visualization and storytelling during my internship.