Microsoft Stock Market Analysis (1986-2022)
Project Information
- Category: Financial Analytics / Stock Market Analysis / Data Visualization
- Client: Quantum Analytics (Internship Project)
- Project Date: Nov 2023
- Tools Used: Tableau, Microsoft Excel
- Data Source: Microsoft Corporation (MSFT) Historical Stock Data
- Project URL: View on Tableau Public
Microsoft Stock Market Analysis: Tracing MSFT's Journey from 1986 to 2022
Summary
As one of my initial projects at Quantum Analytics, I conducted an in-depth stock market analysis of Microsoft Corporation (MSFT) spanning its founding/listing years from 1986 to 2022. This project aimed to visualize and interpret MSFT's historical daily price movements (Open, High, Low, Close, Adjusted Close) and trading volumes. By identifying long-term trends, periods of significant volatility, and potential correlations between price action and market volume, I sought to provide a comprehensive financial overview of one of the world's leading technology companies, capturing its journey from a nascent software firm to a global titan.
1. Introduction: Decoding a Tech Giant's Market Performance
Microsoft Corporation (MSFT) represents a cornerstone of the modern technology industry, with a history of innovation and market dominance. Analyzing its stock performance over decades provides invaluable insights into not only the company's financial health but also broader technological shifts and economic cycles. This project, a key part of my internship at Quantum Analytics, focused on MSFT's daily stock data from 1986 to 2022. My objective was to leverage data visualization to unravel the narrative encapsulated within its stock prices and trading volumes, identifying critical junctures and sustained trends in its market journey.
2. Project Objectives & Goals
My work on this project was structured around clear objectives to deliver impactful financial insights:
Overall Objectives:
- To visualize and analyze the long-term price trajectory of Microsoft stock (MSFT) from 1986 to 2022.
- To identify periods of significant growth, decline, and increased volatility in MSFT's market performance.
- To explore the relationship between daily price movements and trading volume.
- To provide an accessible and insightful view of MSFT's stock market history.
Project Goals & Deliverables:
- Historical Price Trend Visualization: A comprehensive line chart showing the Adjusted Close price of MSFT over the entire 1986-2022 period, highlighting overall growth and major turning points.
- Daily Price Range Analysis: Visualizations (e.g., candlestick charts or OHLC charts for specific periods) to illustrate daily price fluctuations (High, Low, Open, Close), revealing intraday volatility.
- Trading Volume Trends: A separate chart displaying the daily trading volume, allowing for analysis of liquidity and investor interest over time, often correlated with significant price movements.
- Volatility Identification: Metrics or visual cues to pinpoint periods of heightened market volatility for MSFT stock, potentially correlating with economic events or company announcements.
- Comparative Analysis (Optional, if external data used): Although not explicit in the prompt, future expansion could involve comparing MSFT's performance against market indices or other tech giants.
- Interactive Dashboard: A user-friendly Tableau dashboard enabling users to filter by date ranges, examine specific years or months, and drill down into daily data for detailed insights.
3. Data Scope & Metrics
The project utilized historical daily stock market data for Microsoft Corporation (MSFT) from 1986 to 2022. The dataset included the following critical attributes:
- Date: The specific trading day (YYYY-MM-DD).
- Open: The price of the stock when the market opens for the day.
- High: The highest price recorded for the stock during that trading day.
- Low: The lowest price recorded for the stock during that trading day.
- Close: The price of the stock when the market closes for the day.
- Adj Close: The adjusted closing price, which factors in corporate actions like dividends, stock splits, and rights offerings, providing a more accurate representation of historical performance.
- Volume: The total number of shares traded during the day, indicating market activity and liquidity.
Key Insights Derived from Data:
- Exponential Long-Term Growth: The Adjusted Close price clearly showed Microsoft's remarkable long-term growth from its initial public offering years, underscoring its success as a tech innovator and market leader over several decades.
- Impact of Major Tech Booms and Bursts: The data vividly illustrated the periods of significant price surges, notably during the dot-com boom of the late 1990s, followed by the subsequent significant correction. A strong recovery and sustained growth were observed post-2010, reflecting the shift towards cloud computing and services.
- Volume Correlates with Price Volatility: Periods of sharp price movements (both upward and downward) were often accompanied by spikes in trading volume, indicating heightened investor interest and significant market activity during these times. This is a common pattern in stock market dynamics.
- Recovery and Resilience: Despite major market downturns (e.g., 2000 dot-com bust, 2008 financial crisis), Microsoft's stock demonstrated resilience and strong recovery capabilities, consistently reaching new highs over the long term.
- Identifying Key Support/Resistance Levels: The analysis of daily High and Low prices over extended periods helped in conceptually identifying historical price levels where the stock found support or faced resistance.
- Significance of Adjusted Close: By focusing on Adjusted Close, the analysis provided a true representation of an investor's historical returns, factoring in stock splits and dividends, which smoothed out nominal price jumps and dips.
4. Dashboard Design & Key Insights
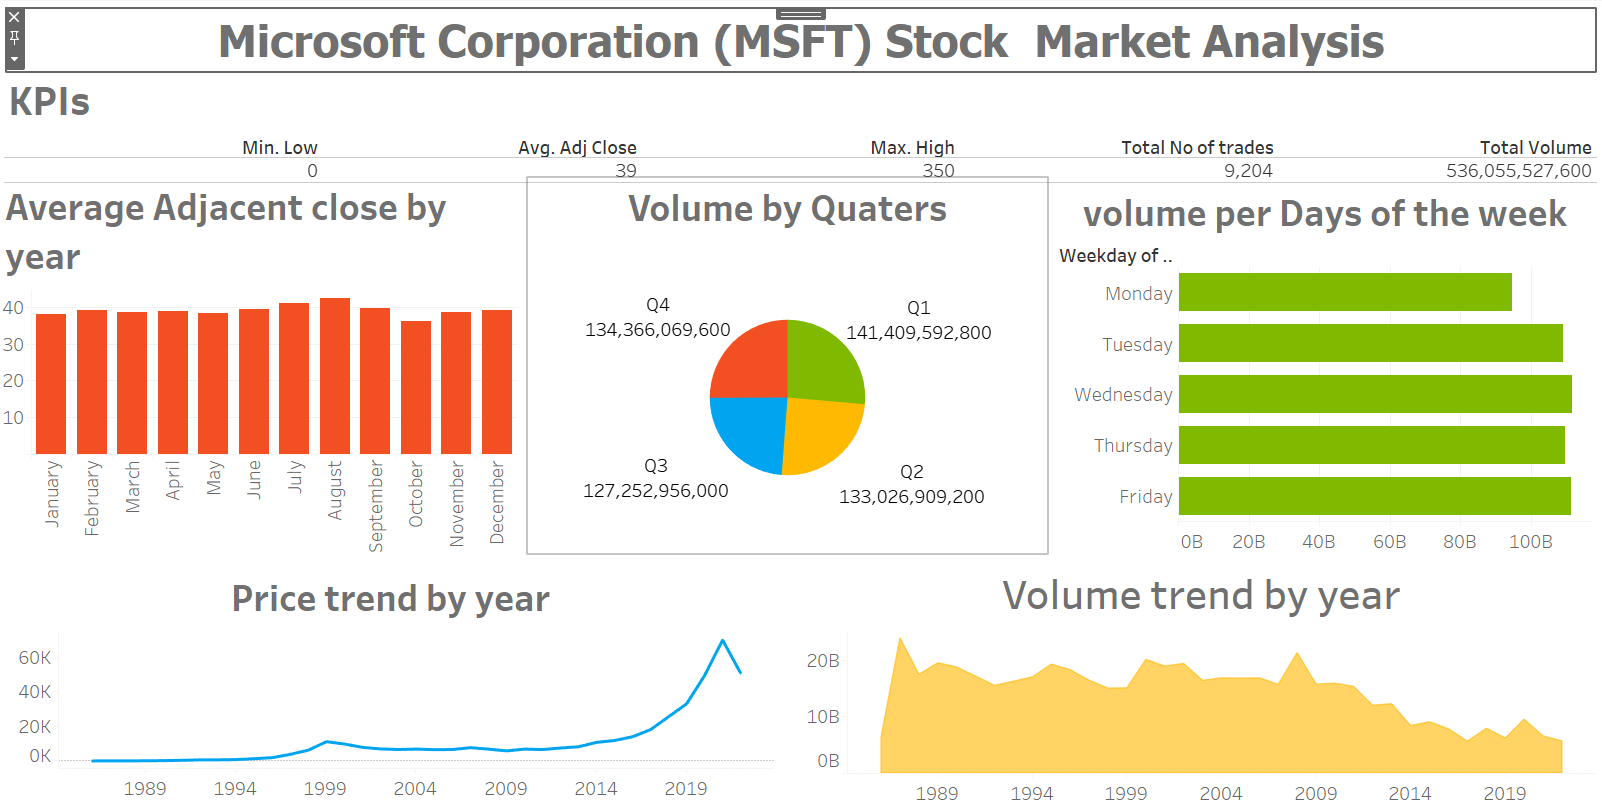
My Tableau dashboard for Microsoft Stock Market Analysis was designed to provide a dynamic and insightful view of MSFT's historical performance, catering to both long-term trend analysis and short-term volatility examination. Key components included:
Dashboard Features and Insights:
- Overall Adjusted Close Price Chart: A prominent line chart displaying the Adjusted Close price from 1986 to 2022, allowing users to observe MSFT's growth trajectory and major historical events.
- Daily Open, High, Low, Close (OHLC) Chart: A detailed OHLC chart (or candlestick chart) for a selectable time range, allowing users to zoom in on daily price action and understand intraday volatility.
- Volume Analysis Chart: A bar chart positioned below the price chart, showing daily trading volume, enabling users to visually correlate volume spikes with price movements.
- Interactive Date Filter: A versatile date range filter or slider, allowing users to dynamically select specific periods of interest (e.g., a specific year, a decade, or a custom range) for detailed analysis.
- Key Metrics Cards: Displaying key performance indicators like total percentage change over the selected period, highest closing price, lowest closing price, and average daily volume.
- Annotations for Key Events (Conceptual): Though not directly in the raw data, the dashboard design implicitly allows for annotations of significant historical events (e.g., Windows launches, CEO changes, major acquisitions) that might have impacted the stock price.
- Tooltip Details: Comprehensive tooltips providing precise Date, Open, High, Low, Close, Adj Close, and Volume data when hovering over data points.
The dashboard's interactive nature made it a powerful tool for understanding Microsoft's financial history, allowing users to explore long-term investment opportunities, analyze market cycles, and study the impact of significant corporate and economic events on the stock's performance.
5. Technical Approach & Tools
This project followed a standard data analysis and visualization pipeline:
- Data Acquisition: The historical daily stock data for Microsoft (MSFT) from 1986 to 2022 was sourced and provided for the Quantum Analytics internship.
- Data Cleaning & Preprocessing (Microsoft Excel): The raw data was prepared in Microsoft Excel. This involved ensuring data integrity, checking for any missing dates or values (though daily stock data is typically very clean), and formatting the 'Date' column correctly to enable time-series analysis in Tableau.
- Exploratory Data Analysis (EDA): Initial checks were performed to understand the range of prices and volumes, identify the earliest and latest dates, and spot any immediate outliers or anomalies before proceeding to Tableau.
- Data Visualization & Dashboarding (Tableau): The core of the project was executed in Tableau Desktop. This included:
- Connecting to the cleaned Excel dataset.
- Creating time-series line charts for price trends, particularly focusing on the Adjusted Close price for true historical comparison.
- Developing area charts or bar charts for volume analysis.
- Utilizing Tableau's built-in date functionalities to create filters and aggregations (e.g., year, quarter, month).
- Designing a cohesive dashboard layout that integrates various charts, allowing for a logical flow of analysis from macro trends to daily details.
- Publishing the final interactive dashboard to Tableau Public for broad accessibility and sharing of insights.
6. Impact & Business Value
This Microsoft Stock Market Analysis project offers significant value to various stakeholders interested in financial markets and corporate performance:
- For Investors and Traders: Provides a historical perspective on MSFT's performance, enabling them to understand long-term growth, assess past volatility, and potentially inform future investment decisions.
- For Financial Analysts: Offers a ready-made dashboard to quickly review and analyze MSFT's stock history, serving as a basis for more in-depth fundamental or technical analysis.
- For Market Enthusiasts: Presents complex stock data in an understandable and engaging visual format, making it easier for non-experts to grasp key financial concepts and trends.
- For Corporate History Researchers: Allows for a unique perspective on Microsoft's journey, showing how market perception and performance evolved alongside its technological innovations and corporate milestones.
- Demonstrates Data Fluency: Highlights the ability to handle and visualize time-series financial data, a critical skill in financial analysis and data science.
7. Conclusion
My Microsoft Stock Market Analysis project at Quantum Analytics was an illuminating exploration into the financial history of a leading tech giant. By meticulously analyzing MSFT's daily stock data from 1986 to 2022 and leveraging Tableau's powerful visualization capabilities, I was able to chart its impressive growth, pinpoint periods of significant market events, and understand the dynamics between price and trading volume. This project not only enhanced my skills in financial data analysis and time-series visualization but also provided a clear, data-driven narrative of Microsoft's enduring journey in the stock market. It was a foundational experience that deepened my understanding of market forces and corporate performance during my internship.