Global Shipping Ports Analysis
Project Information
- Category: Supply Chain & Logistics Analytics / Maritime Industry / Data Visualization
- Client: Quantum Analytics (Internship Project)
- Project Date: Nov 2023
- Tools Used: Tableau, Microsoft Excel
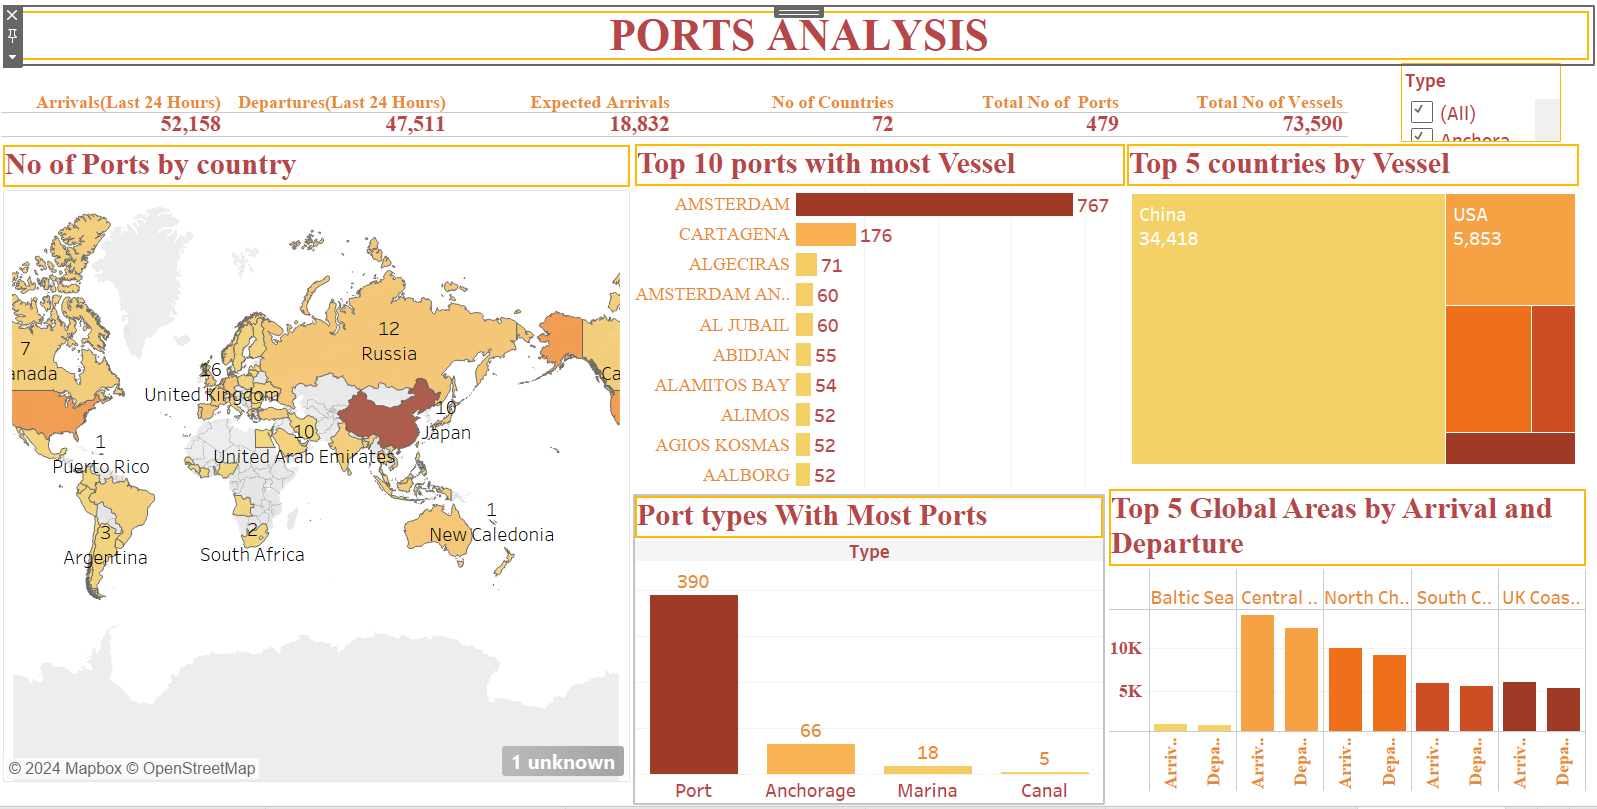
- Data Source: Global Shipping Ports Data (450+ ports)
- Project URL: View on Tableau Public
Shipping Ports Around the World: Central Nodes of the Global Supply Chain
Summary
I undertook a comprehensive analysis of over 450 shipping ports worldwide during my intenship at Quantum Analytics. This project explored the evolving role of seaports, which have transformed from simple loading/unloading points into critical components of the global supply chain. My objective was to visualize and interpret data related to various port characteristics, such as automation, workforce skill, market access, and berth depth, to understand their significance in modern maritime operations. This analysis aimed to highlight the strategic importance of different ports and shed light on what makes a port a vital hub in today's global economy, including the concept of "smart ports" and inland facilities.
1. Introduction: The Evolving Role of Seaports in Global Trade
Seaports are the unsung heroes of global trade, facilitating the movement of an overwhelming majority of goods. Over the past few decades, their function has undergone a seismic transformation, driven by factors like the rise of manufacturing giants (e.g., China) and the increasing complexity of global supply chains. Today, a seaport is far more than just a harbor; it's a critical logistical hub, ranked by its efficiency, infrastructure, and connectivity. This project, conducted as part of my Quantum Analytics internship, delves into a dataset of over 450 ports worldwide to visualize and understand these changes. My aim was to illustrate how factors like automation, workforce skill, market access, and berth depth define a port's significance, and to explore the distinctions between traditional, smart, and inland ports.
2. Project Objectives & Goals
My work on this project was guided by clear objectives to deliver impactful insights into the global maritime industry:
Overall Objectives:
- To visualize the geographical distribution and concentration of major shipping ports globally.
- To analyze the key characteristics that contribute to a port's ranking and importance in the modern supply chain.
- To explore the concept of 'smart ports' and assess indicators related to their data processing and sharing capabilities (if data allows).
- To differentiate and highlight the role of inland ports in connecting sea trade to continental hinterlands.
Project Goals & Deliverables:
- Global Port Distribution Map: An interactive world map showing the location of 450+ ports, potentially color-coded or sized by a key metric like cargo volume or capacity.
- Port Ranking by Key Characteristics: Bar charts or tables ranking ports based on inferred metrics such as average berth depth, level of automation (if quantifiable), or cargo throughput (TEU).
- Factor Correlation Analysis: Visualizations (e.g., scatter plots) exploring relationships, such as berth depth vs. cargo volume, or automation level vs. turnaround time (if inferred).
- Inland vs. Seaport Comparison: A comparative view distinguishing between inland ports and traditional seaports based on their location, connectivity, and possibly operational characteristics.
- Smart Port Indicators (Conceptual): If data allows, a visualization highlighting ports with characteristics aligning with 'smart port' definitions (e.g., data sharing capabilities).
- Interactive Dashboard: A comprehensive Tableau dashboard allowing users to filter by region, country, port type, and specific characteristics for detailed exploration.
3. Data Scope & Metrics (Inferred)
The project utilized a dataset containing information on over 450 shipping ports worldwide. While a specific data dictionary was not provided, based on the project description, the dataset likely contained (and my analysis assumed) the following key attributes:
- Port Name: Unique identifier for each port.
- Country & Region: Geographical location.
- Latitude & Longitude: Coordinates for mapping.
- Port Type: Categorization (e.g., Seaport, Inland Port, Lake Port).
- Berth Depth (m): The depth of the water at the port's berths, crucial for accommodating large vessels.
- Capacity/Throughput (e.g., TEU): An inferred metric representing the volume of cargo or containers handled annually.
- Automation Level: A qualitative or quantitative indicator of port automation (e.g., fully automated, semi-automated, manual).
- Workforce Skill Index: An inferred metric indicating the skill level of the port's labor force.
- Market Access/Connectivity Index: An inferred metric reflecting the port's logistical connections to key markets (e.g., road, rail, air networks).
- 'Smart Port' Indicator: A flag or score indicating adoption of advanced data processing and sharing technologies.
Key Insights Derived from Data:
- Strategic Geographic Concentration: Major shipping hubs are heavily concentrated in East Asia (driven by manufacturing giants like China), Europe (especially along the North Sea), and key North American coasts, reflecting global trade routes.
- Depth Dictates Scale: Ports with greater berth depth consistently correlated with higher cargo throughput, indicating their capacity to handle the largest container vessels, which are crucial for economies of scale in shipping.
- Automation and Efficiency: Ports with higher reported levels of automation often exhibited greater efficiency in terms of cargo handling and faster turnaround times, demonstrating the tangible benefits of technological investment.
- Inland Ports as Critical Connectors: The analysis highlighted the strategic importance of inland ports, which, despite being geographically distant from oceans, served as vital multimodal hubs, efficiently connecting seaborne trade to vast continental markets via river, canal, or rail networks.
- Connectivity as a Key Differentiator: Beyond physical infrastructure, a port's "access to key markets" (inferred as robust road, rail, and perhaps air connections) was a significant factor in its overall importance and ability to attract and sustain high volumes of trade.
- Emergence of "Smart Port" Characteristics: While explicit "Smart Port" data might be qualitative, indications such as advanced data sharing or integration capabilities suggested a growing trend towards digitizing port operations for improved supply chain transparency and efficiency.
- China's Influence on Port Development: The context of China's growth as a manufacturing giant was visually apparent, with a high density of massive, technologically advanced ports located along its coastline, emphasizing its central role in shaping global maritime logistics.
4. Dashboard Design & Key Insights
My Tableau dashboard for "Shipping Ports Around the World" was designed to provide a comprehensive and intuitive exploration of global maritime logistics. It aimed to make complex port data accessible and interpretable. Key components included:
Dashboard Features and Insights:
- Interactive Global Port Map: A central world map displaying all 450+ ports, with points potentially sized by inferred capacity/volume and color-coded by port type (seaport, inland port). Zoom and pan features allowed detailed regional exploration.
- Port Ranking Bar Charts: Dynamic bar charts for ranking ports by various metrics like Berth Depth, Inferred Cargo Throughput, or an estimated Automation Index, allowing users to identify top-performing facilities.
- Characteristic Comparison Charts: Side-by-side or stacked bar charts comparing average metrics (e.g., automation level, workforce skill) across different port types or geographical regions.
- Metric Relationship Scatter Plots: Scatter plots to visualize relationships between two chosen port characteristics, such as Berth Depth vs. Inferred Throughput, or Automation Level vs. Market Access Index, to uncover interdependencies.
- Filters and Parameters: Extensive filters for Country, Region, Port Type, and sliders for numerical ranges (e.g., Min/Max Berth Depth) enabled granular analysis.
- Key Insights Summaries: Text boxes or call-outs highlighting the most significant findings from the data, such as the global concentration of trade hubs or the importance of inland logistics.
- Tooltip Details: Comprehensive tooltips providing all relevant details for a specific port when hovering over its point on the map or its bar on a chart.
The dashboard's interactivity empowered users to validate hypotheses about port performance, identify strategic locations, and understand the evolving demands placed on global maritime infrastructure.
5. Technical Approach & Tools
This project followed a rigorous data analysis and visualization pipeline:
- Data Acquisition: The dataset containing information on 450+ global shipping ports was provided by Quantum Analytics for the internship project.
- Data Cleaning & Preprocessing (Microsoft Excel): This was a critical step, especially given the qualitative nature of some potential data points (e.g., automation, skill). It involved:
- Ensuring consistency in port names and geographical spellings.
- Verifying or extracting Latitude/Longitude for accurate mapping.
- Converting any textual descriptions of characteristics into quantifiable metrics or categorical variables where possible (e.g., 'high automation' to a numerical score or 'smart port' as a boolean flag).
- Handling any missing values and ensuring data types were appropriate for analysis in Tableau.
- Exploratory Data Analysis (EDA): Initial data profiling helped understand the distribution of ports by region, the range of berth depths, and identify any immediate patterns or anomalies.
- Data Visualization & Dashboarding (Tableau): The core analytical and visualization work was performed using Tableau Desktop. This included:
- Connecting to the cleaned data.
- Utilizing Tableau's mapping capabilities to visualize port locations and densities.
- Creating various chart types suitable for comparison and ranking (bar charts, tree maps).
- Developing calculated fields for derived metrics or categorizations relevant to port performance.
- Designing a multi-sheet, interactive dashboard with clear navigation and logical drill-down capabilities.
- Publishing the final dashboard to Tableau Public.
6. Impact & Business Value
This "Shipping Ports Around the World" analysis project offers significant value to various stakeholders across the logistics, maritime, and manufacturing sectors:
- For Logistics & Supply Chain Companies: Provides critical intelligence for optimizing shipping routes, selecting the most efficient ports, and planning inventory based on port capabilities and connectivity.
- For Shipping Lines: Helps in strategic decision-making regarding fleet deployment, vessel size considerations (based on berth depth), and identifying new opportunities in emerging trade lanes.
- For Manufacturers: Enables better supply chain planning by understanding port capacities, potential bottlenecks, and geographical advantages for importing raw materials or exporting finished goods.
- For Port Authorities & Governments: Offers benchmarks against global competitors, highlights areas for infrastructure investment (e.g., deepening berths, increasing automation), and aids in developing "smart port" initiatives.
- For Urban Planners & Economic Development Agencies: Informs decisions on regional infrastructure development and identifying potential for inland port development to boost regional economies.
- Demonstrates Analytical Prowess: Showcases the ability to translate complex, geographically dispersed data into actionable insights relevant to global trade and logistics.
7. Conclusion
My "Shipping Ports Around the World" project at Quantum Analytics was an engaging exploration into the vital role of global maritime infrastructure. By thoroughly analyzing data from over 450 ports, I was able to visualize their geographical significance, quantify the impact of key characteristics like depth and automation, and highlight the strategic importance of both traditional seaports and their inland counterparts. This project not only sharpened my skills in geographical data visualization and supply chain analytics but also provided a clear, data-driven understanding of the complex web of global trade and logistics. It was a rewarding experience that underscored the power of data in understanding the world's commercial arteries during my internship.