Unicorn Company Analysis
Project Information
- Category: Data Analytics / Business Intelligence / Startup Ecosystem
- Client/Context: Quantum Analytics Internship Project / Market Research
- Project Date: october 2023(as part of internship)
- Tools Used: Power BI (Power Query, DAX)
- Data Source: Global Unicorn Company Dataset
- Project URL: View Live Dashboard (If available)
Unicorn Company Analysis: Decoding Growth and Trends in the Billion-Dollar Startup Ecosystem
Summary
As my first Power BI project during my internship at Quantum Analytics, this dashboard provides a comprehensive analysis of global unicorn companies. The project involved exploring key metrics such as total valuation, industry distribution, geographical presence, and the trends of unicorn creation and valuation over time. Through meticulous data preparation in Power Query and insightful visualizations, the dashboard aims to uncover patterns in the billion-dollar startup ecosystem, identify dominant industries and countries, and highlight the rapid growth of these highly-valued private companies. This analysis serves as a foundational tool for understanding market dynamics for investors, venture capitalists, and aspiring entrepreneurs.
1. Introduction: The Rise of Unicorns in the Global Economy
Unicorn companies, private startups valued at over $1 billion, are key indicators of innovation, market disruption, and significant investment opportunities. During my internship at Quantum Analytics, my inaugural Power BI project focused on dissecting this unique segment of the global economy. The objective was to transform raw data about these companies into a dynamic and interactive dashboard, enabling a clearer understanding of their growth trajectories, the sectors they dominate, and their geographical concentration. This project was a critical learning experience in end-to-end data analysis within a professional setting.
2. Project Objectives & Goals
The primary objectives for this Power BI project were defined to provide comprehensive insights into the unicorn company landscape:
Overall Objectives:
- To perform exploratory data analysis on global unicorn companies to identify key trends and patterns.
- To analyze the distribution of unicorns by industry and geographical location.
- To visualize the growth of unicorn valuations and the rate of new unicorn creation over time.
- To provide actionable insights for stakeholders interested in the startup and investment ecosystem.
Project Goals & Deliverables:
- Overall Unicorn Metrics: Display key aggregated metrics such as Total Valuation, Total Number of Industries, Total Number of Countries, Total Number of Companies, and Total Number of Cities where unicorns are based.
- Top Countries with the Most Unicorns: Identify and visualize the leading countries by the number of unicorn companies.
- Top Most Valued Industry: Analyze and display the industries with the highest cumulative unicorn valuation.
- Valuation Trend by Year: Show the overall trend of unicorn company valuations over the years.
- Unicorn Trend by Year of Joining: Illustrate the rate at which new companies achieved unicorn status annually.
- Top 10 Most Valued Companies: List the top 10 unicorn companies by their individual valuations.
- Interactive Filtering: Allow users to filter the dashboard by company name and year.
3. Data Scope & Metrics
The analysis utilized a global dataset of unicorn companies, encompassing various attributes about these high-valuation private companies.
Data Source:
- Global Unicorn Company Dataset: Contains information on companies valued at over $1 billion.
- Key Columns :
- Company Name
- Valuation (in billions/trillions)
- Industry
- Country
- City
- Year of Joining (when they became a unicorn)
- Date Last Updated (implied for valuation trend)
Key Data Points & Metrics Captured and Displayed:
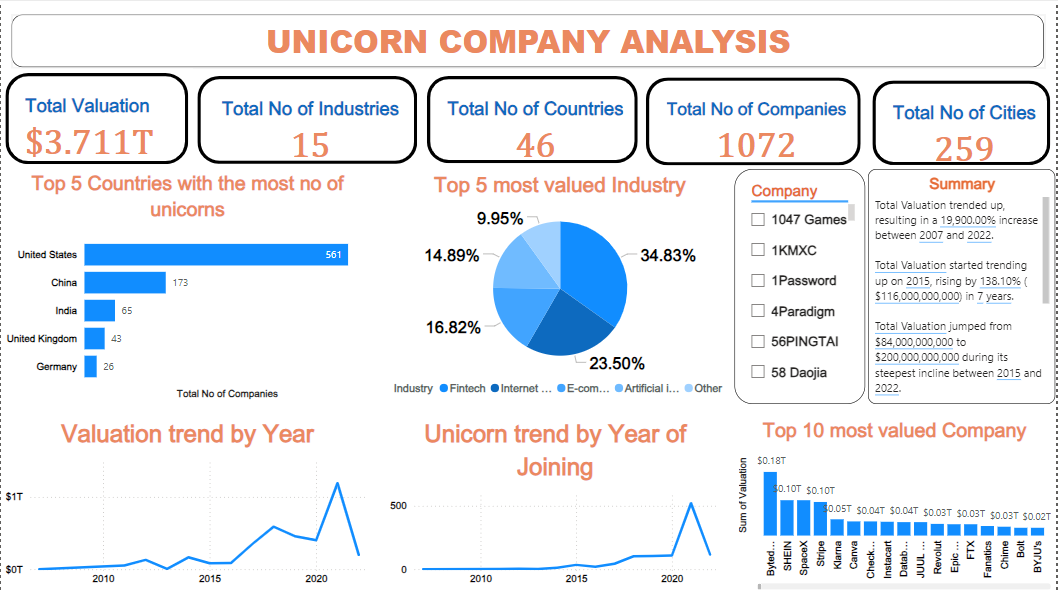
- Total Valuation: $3.711T
- Total Number of Industries: 15
- Total Number of Countries: 46
- Total Number of Companies: 1072
- Total Number of Cities: 259
- Top 5 Countries with the Most Unicorns: United States (561), China (173), India (65), United Kingdom (43), Germany (26).
- Top 5 Most Valued Industry: Fintech (34.83%), Internet (23.50%), E-commerce (16.82%), Artificial Intelligence (14.89%), Other (9.95%).
- Valuation trend by Year: Shows significant fluctuations and overall growth, with notable peaks, reflecting market cycles and large funding rounds.
- Unicorn trend by Year of Joining: Indicates an accelerating pace of new unicorn creation, particularly in recent years.
- Top 10 Most Valued Company: Includes companies like ByteDance, SHEIN, SpaceX, Stripe, Canva, Instacart, among others, with valuations ranging from $0.02T to over $0.18T.
Key Insights Derived from Data:
- The unicorn ecosystem is highly concentrated geographically, with the United States and China dominating in terms of the number of unicorn companies.
- Technology-driven industries such as Fintech, Internet, E-commerce, and Artificial Intelligence account for the vast majority of unicorn valuations, highlighting major areas of innovation and investment.
- There has been a dramatic increase in both the total valuation of unicorn companies and the rate at which new companies achieve unicorn status, especially in recent years, indicating a boom in venture capital activity and technological advancement.
- Specific companies like ByteDance and SHEIN hold exceptionally high valuations, signifying their significant impact and market leadership within the unicorn landscape.
- The data provides clear evidence of which sectors are attracting the most capital and producing the most successful private companies globally.
4. Dashboard Design & Key Insights
The "Unicorn Company Analysis" dashboard is designed to provide a comprehensive and interactive overview of the global unicorn landscape. It prominently displays key metrics and trends to offer immediate insights into this dynamic market.
Dashboard Features and Key Insights:
4.1 Key Performance Indicators (KPIs)
Prominent KPIs at the top provide an immediate overview of the dataset's scale and scope:
- Total Valuation: $3.711T
- Total Number of Industries: 15
- Total Number of Countries: 46
- Total Number of Companies: 1072
- Total Number of Cities: 259
4.2 Geographical and Industry Distribution
- Top 5 Countries with the Most Unicorns (Bar Chart): This chart clearly shows the United States as the dominant country by number of unicorns, followed by China, India, and the United Kingdom, illustrating global startup hubs.
- Top 5 Most Valued Industry (Pie Chart): This chart provides a clear breakdown of industries by their total valuation, highlighting Fintech, Internet, E-commerce, and Artificial Intelligence as the leading sectors for unicorn companies.
4.3 Trend Analysis
- Valuation trend by Year (Line Chart): This chart illustrates the overall growth trajectory of unicorn valuations over time, showing periods of accelerated growth and highlighting the increasing capital flowing into these companies.
- Unicorn trend by Year of Joining (Bar Chart): This visual demonstrates the escalating rate at which new companies are achieving unicorn status, particularly in recent years, underscoring the rapid expansion of the unicorn ecosystem.
4.4 Top Companies and Interactive Filtering
- Top 10 Most Valued Company (Bar Chart): This chart identifies and ranks the top 10 most valuable individual unicorn companies, providing insights into specific market leaders.
- Company Slicer: Allows users to select individual companies to filter the dashboard and analyze specific company data.
- Year Slicer: Enables filtering by year to focus on specific periods, allowing for detailed trend analysis over time.
The dashboard's intuitive design and interactive elements empower users to gain a deep understanding of the unicorn company landscape, identify key players, and track market evolution.
5. Technical Approach & Tools
This project, undertaken during my internship at Quantum Analytics, involved a systematic approach to data analysis using Power BI:
- Data Acquisition & Ingestion: The global unicorn company dataset was imported into Power BI Desktop. This dataset contained various attributes about unicorn companies including their valuation, industry, country, city, and year of joining.
- Data Cleaning & Transformation (Power Query in Power BI): Power Query Editor was utilized for extensive data preparation:
- Handling Inconsistencies: Cleaned inconsistencies in company names, industry classifications, and geographical entries to ensure data accuracy.
- Data Type Standardization: Ensured all numerical fields (e.g., valuation) and date fields were correctly formatted.
- Valuation Normalization: Standardized valuation figures to a consistent unit (e.g., trillions) for accurate aggregation and comparison across companies.
- Date Processing: Extracted 'Year' from relevant date fields to enable time-series analysis for trends.
- DAX (Data Analysis Expressions) Calculations: DAX measures were created to compute key aggregated metrics and enable dynamic calculations:
- Total Valuation = SUM(Unicorns[Valuation])
- NO OF INDUSTRIES = CALCULATE(DISTINCTCOUNT('unicorn companies'[Industry]))
- NO OF COUNTRIES = CALCULATE(DISTINCTCOUNT('unicorn companies'[Country]))
- NO OF COMPANIES = CALCULATE(DISTINCTCOUNT('unicorn companies'[Company]))
- NO OF CITIES = CALCULATE(DISTINCTCOUNT('unicorn companies'[City]))
- Measures for calculating total valuation by industry, number of unicorns by country, and trends over time.
- Data Visualization & Dashboarding (Power BI Desktop): The dashboard was designed with a focus on clear and insightful representation:
- KPI Cards: For prominent display of overall metrics.
- Bar Charts: Used for comparing top countries, top companies, and unicorn trends by year of joining.
- Pie Chart: To show the distribution of valuation by industry.
- Line Charts: For visualizing valuation trends over time.
- Slicers: Implemented for interactive filtering by company and year.
- Publishing & Sharing (Power BI Service): The final interactive report was published to the Power BI Service, demonstrating the capabilities of Power BI for business intelligence and showcasing the project as part of the Quantum Analytics internship experience.
6. Impact & Business Value
This Power BI project, developed during my internship at Quantum Analytics, delivers significant value to various stakeholders in the startup and investment community:
- Informed Investment Strategies: Provides venture capitalists and angel investors with a data-driven view of high-growth industries and geographical hotspots for potential investment.
- Market Trend Identification: Helps identify emerging trends in the unicorn ecosystem, including the rapid increase in unicorn creation and the dominance of specific tech sectors.
- Competitive Intelligence: Allows entrepreneurs and existing companies to benchmark themselves against successful unicorns and understand the market landscape.
- Strategic Business Planning: Aids startups in understanding market saturation, identifying niches, and strategizing for growth based on industry and country performance.
- Demonstration of Analytical Skills: As an internship project, it effectively showcases proficiency in data cleaning, transformation, DAX calculations, and impactful data visualization using Power BI, critical skills gained at Quantum Analytics.
7. Conclusion
This Power BI project on Unicorn Company Analysis successfully delivers a comprehensive and interactive analytical tool for understanding the global unicorn ecosystem. As my first major project during my internship at Quantum Analytics, it provided invaluable hands-on experience in the entire data analysis lifecycle, from raw data to actionable insights. By meticulously processing and visualizing complex startup data, the dashboard offers critical intelligence on valuation trends, industry leadership, and geographical concentrations. This analysis not only serves as a vital resource for market understanding but also stands as a testament to my developing skills in business intelligence and data visualization, cultivated during my time at Quantum Analytics.