International Trade and Finance Data Analysis
Project Information
- Category: Economic Data Analysis / International Relations / Data Visualization
- Client: Quantum Analytics (Internship Project)
- Project Date: December 2023
- Tools Used: Tableau, Microsoft Excel
- Data Source: United Nations Development Program (UNDP) - Trade and Finance Flows
- Project URL: View on Tableau Public
International Trade and Finance Data Analysis: A Global Economic Outlook
Summary
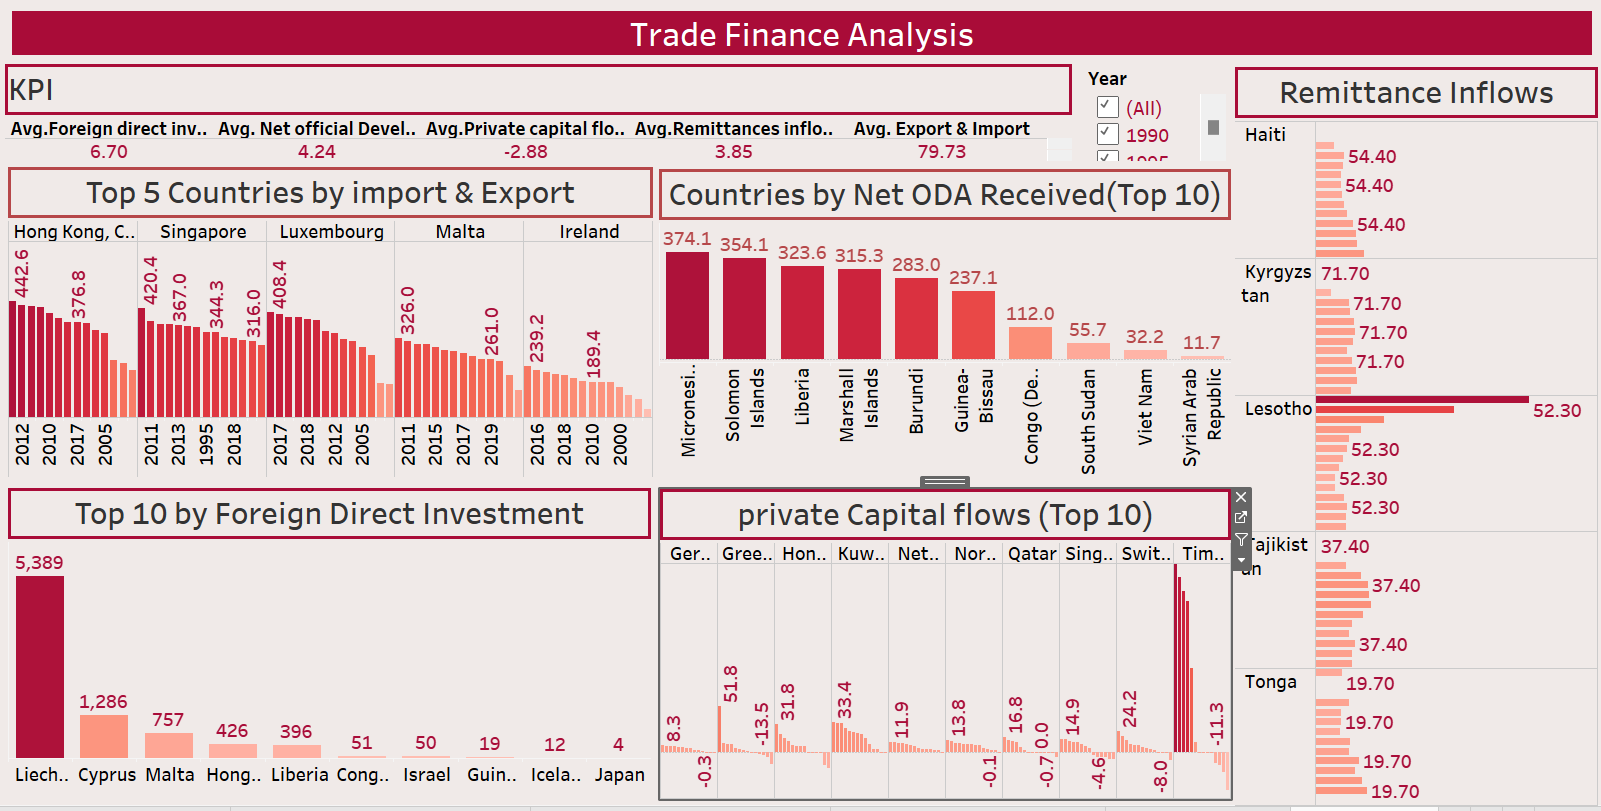
This project focused on International Trade and Finance Data Analysis, involving the examination of historical trade and financial flows for over 190 countries using data from the United Nations Development Program (UNDP) for 2019. My objective was to visualize and interpret key economic indicators such as Exports and Imports (% of GDP), Foreign Direct Investment, Official Development Assistance, Private Capital Flows, and Remittances (% of GDP). Through this analysis, I aimed to uncover global economic patterns, identify countries with significant trade and finance dependencies, and address data quality challenges related to missing internationally comparable data, providing a comprehensive visual overview of the global economic landscape.
1. Introduction: Navigating Global Economic Interconnections
In an increasingly interconnected world, understanding the flow of trade and finance between nations is crucial for economic development, policy formulation, and investment strategies. This project, conducted as part of my internship at Quantum Analytics, utilizes a rich dataset from the United Nations Development Program (UNDP) focusing on 'Trade and Finance flows' for over 190 countries in 2019. The aim was to shed light on various facets of global economic interaction, from trade balances to capital movements and aid. By analyzing these critical indicators, I sought to provide a clear, data-driven perspective on the diverse economic realities shaping nations worldwide.
A key challenge and focus of this project was also to understand and address the nuances of data availability and comparability across different countries, as highlighted by the presence of missing values in the dataset.
2. Project Objectives & Goals
My work on this project was guided by clear objectives to deliver insightful analyses of international economic data:
Overall Objectives:
- To visualize and compare key trade and finance indicators across more than 190 countries.
- To identify global and regional patterns in exports, imports, foreign direct investment, official development assistance, private capital, and remittances.
- To analyze the implications of these economic flows on countries' development and economic structures.
- To effectively manage and communicate insights from a dataset with varying data completeness.
Project Goals & Deliverables:
- Global Trade Balance Visualization: A world map or bar charts illustrating countries' export and import dependencies relative to their GDP, highlighting trade surpluses or deficits.
- Foreign Direct Investment (FDI) Hotspots: A map or ranking of countries by net FDI inflows (% of GDP), identifying key investment destinations.
- Development Aid and Capital Flows: Visualizations comparing Net Official Development Assistance (ODA) received with Private Capital Flows across nations, examining their relative importance for different economies.
- Remittance Impact Analysis: A ranking or map showing the contribution of remittances to countries' GDP, highlighting economies significantly supported by diaspora income.
- Comparative Indicator Dashboard: An interactive dashboard allowing for cross-indicator comparison for individual countries or regions, revealing economic dependencies and vulnerabilities.
- Data Completeness Overview: Visual elements that transparently show data availability (e.g., countries with missing HDI ranks or specific indicator data), acknowledging data limitations.
3. Data Scope & Metrics
The project utilized data from the United Nations Development Program (UNDP), specifically the 'Trade and Finance flows' dimension for the year 2019. This dataset covered over 190 countries and included the following key indicators, all expressed as a percentage of GDP (unless otherwise noted):
- Exports and Imports (% of GDP): Represents the volume of goods and services traded relative to a country's economic output.
- Foreign direct investment, net inflows (% of GDP): Measures the net flow of foreign investment into a country's economy.
- Net official development assistance received (% of GNI): Quantifies aid received by a country from official sources, relative to its Gross National Income.
- Private capital flows (% of GDP): Reflects private sector financial investments moving into or out of a country.
- Remittances, inflows (% of GDP): The value of personal transfers and compensation of employees received by resident households from non-resident households, relative to GDP.
- HDI Rank: The Human Development Index rank, though some countries had '..' indicating non-comparable data.
A notable aspect of the data was the presence of '..' for missing values, indicating either non-comparable data for HDI Rank or simply unpublished data for specific indicators.
Key Insights Derived from Data:
- Trade Openness Varies Widely: Analysis of Exports and Imports (% of GDP) showed a significant range across countries. Small island developing states and some European economies exhibited very high trade openness, indicating heavy reliance on international trade, while larger economies might have lower percentages due to a larger domestic market.
- Emerging Economies Attract FDI: Countries in Southeast Asia and parts of Africa demonstrated robust Foreign Direct Investment (FDI) inflows, signaling growing economies and attractive investment climates. Conversely, some developed nations showed lower net inflows, reflecting capital outflows or saturation.
- ODA vs. Private Capital: For many low-income countries, Net Official Development Assistance (ODA) remained a crucial source of external finance. However, a noticeable trend in some developing economies was the increasing role of Private Capital Flows, suggesting growing investor confidence and market development.
- Remittances as Economic Pillars: In several countries, particularly those with large diaspora populations, Remittances accounted for a substantial percentage of GDP, serving as a vital source of foreign exchange and supporting household consumption and investment. This was particularly prominent in parts of South Asia and Sub-Saharan Africa.
- Data Gaps and Development Status: It was observed that countries with '..' for HDI Rank or specific indicators often corresponded to smaller nations or those with less established statistical reporting mechanisms, highlighting challenges in collecting globally comparable economic data. This necessitated careful interpretation and clear communication of data limitations.
- Interplay of Flows: The dashboard allowed for the visual exploration of relationships, such as how some countries with high ODA inflows might have lower private capital flows, or how robust remittances could offset trade deficits in certain economies, showcasing diverse economic strategies.
4. Dashboard Design & Key Insights
My Tableau dashboard for International Trade and Finance Data was designed to offer a multifaceted view of global economic flows, emphasizing clarity and comparability across countries. Key components included:
Dashboard Features and Insights:
- Global Indicator Maps: Separate choropleth maps for each key indicator (Exports, Imports, FDI, ODA, Private Capital, Remittances), allowing users to visually identify global hotspots and coldspots for each flow.
- Country-Specific Trendlines/Comparisons: A section enabling users to select specific countries and view their values for all indicators side-by-side, facilitating quick country-level economic profiles.
- Top/Bottom Performers: Dynamic bar charts showing the top and bottom N countries for each indicator, providing quick insights into leaders and laggards in various economic flows.
- Indicator Relationship Scatter Plots: Scatter plots to explore correlations between two chosen indicators (e.g., FDI vs. Exports, Remittances vs. ODA), helping to visualize potential economic relationships or dependencies.
- Data Quality Disclaimer/Filter: A visual element or filter to highlight countries with missing data ('..'), ensuring transparency and allowing users to exclude or specifically examine these cases.
- Regional Filters: Ability to filter data by continent or geopolitical region to compare economic patterns within specific geographical blocs.
- Tooltip Details: Comprehensive tooltips on maps and charts to provide detailed indicator values and country information upon hovering.
The dashboard's interactive features allowed for granular analysis, enabling users to delve into specific country profiles, compare regional trends, and understand the relative importance of different financial flows for various economies.
5. Technical Approach & Tools
This project followed a standard data analysis and visualization pipeline:
- Data Acquisition: The UNDP International Trade and Finance dataset for 2019 was provided by Quantum Analytics.
- Data Cleaning & Preprocessing (Microsoft Excel): This was a crucial step due to the '..' values. In Microsoft Excel, these non-numeric indicators were handled. Depending on the desired analysis, they were either replaced with nulls or excluded from calculations, while ensuring that countries with valid data were retained. Data types were verified and adjusted for numerical operations in Tableau.
- Exploratory Data Analysis (EDA): Initial summaries and basic aggregations were performed in Excel to understand the distribution of values for each indicator and identify the extent of missing data across countries.
- Data Visualization & Dashboarding (Tableau): The core of the project was executed in Tableau Desktop. This included:
- Connecting to the prepared Excel dataset.
- Creating calculated fields to manage and interpret the '..' values, potentially converting them to a recognizable null format for Tableau.
- Developing a variety of visualizations tailored to each indicator and comparative analysis (e.g., world maps for geographic patterns, bar charts for rankings, scatter plots for correlations).
- Building a cohesive and interactive dashboard structure that allows users to seamlessly navigate between different views and explore various aspects of the data.
- Publishing the final interactive dashboard to Tableau Public for external access.
6. Impact & Business Value
This International Trade and Finance Data Analysis project offers significant value to various stakeholders involved in global economics and development:
- Informing International Business Strategy: Companies looking to expand globally can use these insights to identify potential markets based on trade openness, FDI inflows, and economic stability indicated by financial flows.
- Guiding Investment Decisions: Investors can assess a country's economic health and stability by analyzing trends in private capital flows and FDI, aiding in risk assessment and opportunity identification.
- Supporting Development Agencies: Organizations like the UNDP can leverage these visualizations to understand the impact of development assistance, identify countries most reliant on aid, and assess the effectiveness of their programs.
- Enhancing Economic Policy Formulation: Governments and policymakers can use the insights to understand their country's position in the global economy, compare themselves to peers, and formulate policies related to trade agreements, investment promotion, or aid dependency.
- Academic and Research Value: Provides a foundation for researchers studying global economic trends, dependencies, and the impact of various financial flows on national development.
- Demonstrating Data Literacy: The project highlights the ability to work with and derive meaning from complex, real-world international datasets that often come with data quality challenges.
7. Conclusion
My International Trade and Finance Data Analysis project at Quantum Analytics successfully transformed raw UNDP data into a compelling visual narrative of global economic interconnections. By meticulously cleaning and analyzing 2019 data for over 190 countries, I was able to illuminate patterns in exports, imports, FDI, ODA, private capital, and remittances, while also transparently addressing the challenges of missing data. The Tableau dashboard created serves as a powerful tool for understanding which nations drive trade, attract investment, or rely heavily on aid and remittances. This experience significantly broadened my expertise in economic data analysis and reinforced my ability to extract and communicate complex global insights within a professional internship setting.