2012 Mexico Restaurant Analysis
Project Information
- Category: Data Analytics / Consumer Behavior / Hospitality
- Client/Context: Quantum Analytics/ Restaurant Industry Research / Market Investment
- Project Date: December 2023
- Tools Used: Power BI (Power Query, DAX)
- Data Source: 2012 Mexico Restaurant Ratings Dataset
- Project URL: View Live Dashboard (If available)
2012 Mexico Restaurant Analysis: Unveiling Consumer Preferences and Market Opportunities
Summary
This Power BI project presents an in-depth analysis of 2012 Mexico restaurant ratings, leveraging data from real consumers. The dashboard offers insights into restaurant performance, consumer demographics, preferred cuisines, and factors influencing ratings such as smoking/drinking policies and budget. With a dataset covering 130 restaurants across 4 cities and 138 consumers, the analysis identifies top-rated restaurants, popular cuisines, and potential demand-supply gaps. Through interactive visualizations, this project aims to provide strategic intelligence for restaurant owners, potential investors, and market researchers interested in the Mexican culinary landscape.
1. Introduction: Decoding Mexico's Restaurant Landscape
The restaurant industry in Mexico is vibrant and diverse, making consumer feedback and market understanding critical for success. This project utilizes a valuable dataset of 2012 restaurant ratings to explore the dynamics between restaurants, consumers, and their preferences. Understanding what drives high ratings, who the consumers are, and where market gaps exist is essential for both existing businesses aiming for improvement and new ventures seeking profitable opportunities. This analysis tackles these questions, providing a data-driven perspective on the Mexican restaurant market.
2. Project Objectives & Goals
The primary objectives for this Power BI project were defined to provide comprehensive insights into the 2012 Mexico restaurant market:
Overall Objectives:
- To identify key characteristics of highly-rated restaurants and understand consumer preferences that influence ratings.
- To analyze consumer demographics and behavior patterns within the dataset.
- To uncover potential demand and supply gaps in the Mexican restaurant market.
- To provide data-driven recommendations for restaurant investment and operational improvements.
Project Goals & Deliverables:
- Overall Market Overview: Display key metrics such as Total No. of Restaurants, Cities covered, Total No. of Consumers, and Restaurant Cuisines available.
- Top Rated Restaurants: List restaurants with the highest overall, food, and service ratings.
- Consumers by City and State: Visualize the distribution of consumers across different cities and states.
- Restaurants by Smoking and Drinking Policies: Analyze how these characteristics relate to restaurant numbers.
- Total No of Consumers by Budget: Understand consumer spending habits.
- Total Restaurant by Cuisine: Identify the most prevalent cuisines.
- Preferred Cuisine by Customers: Understand what cuisines customers prefer, allowing for comparison with supply.
- Total No of Restaurants by Price (Budget): Analyze the distribution of restaurants across different price points.
- Interactive Filters: Allow users to filter by City, Parking availability, and Consumer type (Yes/No).
3. Data Scope & Metrics
The analysis leveraged a dataset containing restaurant ratings from Mexico in 2012, along with detailed information about restaurants and consumers.
Data Source:
- 2012 Mexico Restaurant Ratings Dataset: Includes information about restaurants (characteristics, cuisines) and consumers (preferences, demographics, ratings).
- Key Entities/Tables (as inferred from dashboard content):
- `Restaurants` (restaurant ID, name, city, state, smoking/drinking policy, pricing/budget, parking)
- `Consumers` (consumer ID, city, state, preferred cuisines)
- `Ratings` (consumer ID, restaurant ID, food rating, overall rating, service rating)
- `Cuisines` (restaurant ID, cuisine type)
Key Data Points & Metrics Captured and Displayed:
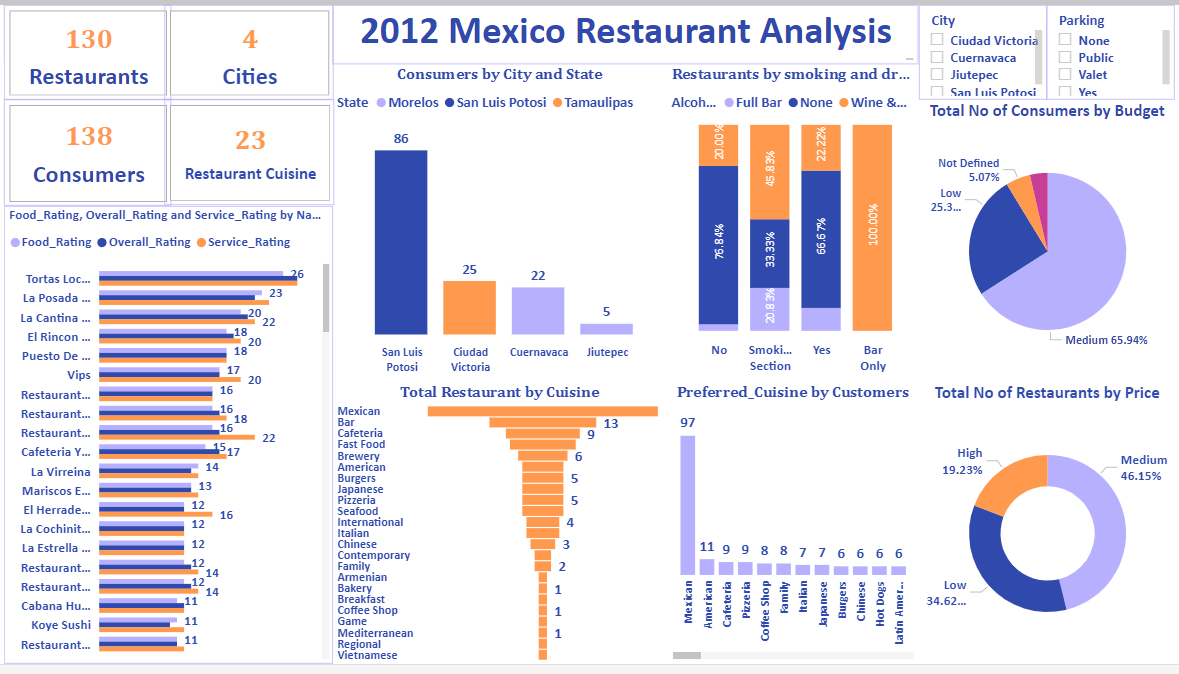
- Total Restaurants: 130
- Cities Covered: 4 (Ciudad Victoria, Cuernavaca, San Luis Potosi, Xalapa)
- Total Consumers: 138
- Restaurant Cuisine Types: 23
- Top Rated Restaurants (Food/Overall/Service Rating): 'Tortas Loc...', 'La Posada...', 'La Cantina...', etc., with ratings from 26 down to 11.
- Consumers by City and State: San Luis Potosi (86), Cuernavaca (25), Ciudad Victoria (22), Jilutepec (5).
- Restaurants by Smoking and Drinking: High percentage of 'No' smoking (78.84%) and 'Full Bar' (45.03%) for drinking.
- Total No of Consumers by Budget: Medium (65.94%) is the largest segment, followed by Low (25.3%) and Not Defined (5.07%).
- Total Restaurant by Cuisine: Mexican (13), Bar (9), Cafe (6) are among the most common.
- Preferred Cuisine by Customers: Mexican (97), Cafeteria (11), Pizzeria (9) are top preferences.
- Total No of Restaurants by Price: Medium (46.15%) and Low (34.62%) price ranges dominate.
Key Insights Derived from Data:
- San Luis Potosi has the highest concentration of consumers in the dataset, suggesting it's a key market.
- The majority of consumers (65.94%) have a medium budget, indicating a strong demand for mid-range dining options.
- Mexican cuisine is both the most supplied (Total Restaurant by Cuisine) and the most preferred (Preferred Cuisine by Customers), indicating a robust local market. However, given the high preference, there might still be room for more diverse, high-quality Mexican restaurants.
- There is a significant number of restaurants with 'No' smoking policies (78.84%), aligning with potential public health trends or regulations.
- Most restaurants fall into the 'Medium' and 'Low' price categories, aligning with the majority consumer budget. This could signal a competitive landscape in these segments.
- Comparing 'Total Restaurant by Cuisine' and 'Preferred Cuisine by Customers' can highlight potential demand-supply gaps. For example, while Mexican is preferred, the number of restaurants aligns, but for other cuisines, a gap might exist.
4. Insights and Analysis from the Dashboard
4.1 What can you learn from the highest rated restaurants? Do consumer preferences have an effect on ratings?
Top-rated restaurants like "Tortas Loc..." consistently achieve high scores across food, service, and overall experience, indicating that a holistic positive dining experience is critical for success.
Consumer preferences significantly influence ratings. The dashboard shows strong preferences for Mexican cuisine and medium-to-low budgets. Restaurants aligning with these preferences, along with amenities like a full bar, are more likely to attract customers and receive higher ratings.
4.2 What are the consumer demographics? Does this indicate a bias in the data sample?
The consumer base primarily originates from San Luis Potosi (62%), with significant proportions also from Cuernavaca and Ciudad Victoria. The dominant budget preference is "Medium" (66%), followed by "Low" (25%). Consumers also show clear preferences regarding smoking and drinking policies.
Yes, the data exhibits significant geographic bias towards San Luis Potosi and a strong budget bias towards medium and low-income consumers. This limits the generalizability of findings, making them most applicable to these specific regions and budget segments rather than the entire Mexican restaurant market or high-end dining.
4.3 Are there any demand & supply gaps that you can exploit in the market?
Clear demand-supply gaps exist for American, Italian, Japanese, and Latin American cuisines, where customer preference notably outweighs current restaurant supply, indicating strong potential for new investments.
Conversely, the "Cafeteria" cuisine segment appears somewhat saturated (more supply than demand), and the "Family" cuisine market is balanced. New ventures in these areas would require strong differentiation to succeed.
4.4 If you were to invest in a restaurant, which characteristics would you be looking for?
For investment, I would prioritize:
- Strategic Alignment: Restaurants aligning with the dominant Mexican cuisine preference (perhaps with a unique niche) or targeting American, Italian, Japanese, or Latin American cuisines to fill existing demand gaps.
- Budget Focus: A strong emphasis on the medium-to-low budget segments to cater to the majority consumer base.
- Performance & Experience: A proven ability to deliver consistently high food quality, excellent service, and a positive overall dining atmosphere to ensure top ratings.
- Location: Preferably in San Luis Potosi due to its high consumer concentration, or other cities showing strong consumer presence in the dataset.
- Amenities: Offering a full bar or wine/beer options would be a significant advantage, aligning with consumer preferences.
5. Technical Approach & Tools
The project involved consolidating and analyzing data from multiple tables to build a comprehensive view of the Mexico restaurant market:
- Data Acquisition & Ingestion: The dataset,comprising multiple CSV files (restaurants, consumers, ratings, cuisines), was imported into Power BI Desktop.
- Data Cleaning & Transformation (Power Query in Power BI): Power Query Editor was utilized to prepare and integrate the various data tables:
- Table Merging & Relationships: Established robust relationships between `Restaurants`, `Consumers`, `Ratings`, and `Cuisines` tables using appropriate join types (e.g., `Merge Queries`) to create a unified data model.
- Data Type Standardization: Ensured all columns were correctly typed (e.g., numbers for ratings, text for names/cuisines).
- Handling Missing Values/Inconsistencies: Addressed any missing values or inconsistent entries in restaurant characteristics or consumer demographics.
- Categorization/Grouping: Grouped similar cuisine types or budget categories where necessary for better aggregation and visualization.
- DAX (Data Analysis Expressions) Calculations: DAX measures were created to compute key business metrics and aggregations:
- `Total No of Restaurants = COUNTROWS(RestaurantsTable)`
- `Total No of Consumers = DISTINCTCOUNT(Consumers[consumer_id])`
- `Total No of Cities = DISTINCTCOUNT(Restaurants[city])`
- `Total No of Restaurant Cuisine = DISTINCTCOUNT(Cuisines[cuisine_type])`
- Measures for average food/overall/service ratings, counts by city/budget, and cuisine preferences.
- Data Visualization & Dashboarding (Power BI Desktop): The dashboard was designed to provide clear and actionable insights:
- KPI Cards: For quick summaries of total entities.
- Bar Charts: Used extensively for showing distributions (e.g., Consumers by City, Restaurants by Smoking/Drinking, Preferred Cuisines, Top Rated Restaurants).
- Pie/Donut Charts: For visualizing proportions like 'Total No of Consumers by Budget' and 'Total No of Restaurants by Price'.
- Slicers: For interactive filtering by City, Parking, and Consumer type.
- Publishing & Sharing (Power BI Service): The final interactive report was published to the Power BI Service for broader access and sharing with stakeholders interested in the Mexican restaurant market.
6. Impact & Business Value
This Power BI dashboard for the 2012 Mexico Restaurant Analysis delivers significant value to various stakeholders:
- Strategic Investment Decisions: Provides insights into highly-rated restaurants and consumer preferences, guiding potential investors on which characteristics (e.g., cuisine, pricing, amenities) to look for in a new venture.
- Market Understanding: Helps existing restaurant owners and new entrants understand the competitive landscape, dominant cuisines, and consumer budget segments.
- Operational Improvements: Restaurants can analyze the ratings of their competitors and top performers to identify areas for improvement in food quality or service.
- Demand-Supply Gap Identification: By comparing restaurant supply (Total Restaurant by Cuisine) with consumer demand (Preferred Cuisine by Customers), the dashboard helps identify underserved culinary niches.
- Targeted Marketing: Insights into consumer demographics and city-specific consumer concentrations can inform more effective marketing strategies.
- Bias Awareness: Analyzing consumer demographics helps in understanding potential biases in the data sample, which is critical for accurate interpretation of findings.
7. Conclusion
This Power BI project successfully provides a comprehensive and interactive analytical tool for exploring the 2012 Mexican restaurant market. By integrating and visualizing data on restaurant characteristics, consumer preferences, and ratings, the dashboard offers actionable insights into market dynamics, consumer behavior, and potential investment opportunities. The analysis serves as a valuable resource for stakeholders seeking to make data-driven decisions within the vibrant Mexican culinary industry.