World Energy Consumption Analysis
Project Information
- Category: Data Analytics / Energy & Environment / Global Trends
- Client/Context: Quantum Analytics/Global Energy Research & Policy Analysis
- Project Date: December 2023
- Tools Used: Power BI (Power Query, DAX)
- Data Source: Our World in Data – Energy Dataset
- Project URL: View Live Dashboard (If available)
World Energy Consumption Analysis: Global Trends and Country-Level Insights
Summary
This Power BI project provides a comprehensive analysis of global energy consumption patterns, leveraging the extensive "Our World in Data" energy dataset. The dashboard explores various facets of energy use, including primary energy, energy mix, electricity mix, and country-level consumption. It incorporates data from key sources like the BP Statistical Review of World Energy, SHIFT Data Portal, and EMBER. The project involved crucial data alterations, such as standardizing country names, recalculating primary energy into terawatt-hours (TWh), and deriving per capita figures. Through interactive visualizations, the analysis aims to highlight global energy trends, identify major consumers and producers, and shed light on the evolving energy landscape to support informed decision-making for policymakers, researchers, and environmental strategists.
1. Introduction: Understanding the Global Energy Landscape
Global energy consumption patterns are fundamental to understanding economic development, environmental impact, and geopolitical stability. The "Our World in Data" energy dataset provides a rich, regularly updated source for exploring these complex dynamics. This project harnesses this data to create a Power BI dashboard that simplifies complex energy metrics into actionable insights. By analyzing energy consumption by different countries, energy mix, and electricity generation, the goal is to offer a clearer picture of how the world powers itself, identify trends in energy sources, and provide a foundation for discussing sustainable energy futures.
2. Project Objectives & Goals
The primary objectives for this Power BI project were defined to provide comprehensive insights into global energy consumption:
Overall Objectives:
- To analyze global energy consumption trends over time, distinguishing between different energy sources.
- To identify key countries and regions dominating energy production and consumption.
- To provide a clear, interactive platform for exploring the world's energy mix and electricity generation.
- To support data-driven discussions on energy policy, sustainability, and resource management.
Project Goals & Deliverables:
- Overall Energy Consumption Metrics: Display key aggregated metrics like Sum of electricity generation, Sum of nuclear consumption, Primary energy consumption, Renewable energy consumption, and Total Oil Consumption.
- Energy Consumption Trends by Type and Year: Graph the consumption of various energy sources (Coal, Gas, Hydro, Nuclear, Oil, Primary, Renewables, Solar, Wind) annually over time.
- Country-Level Production and Consumption: Identify top countries for Oil, Coal, and Gas production and consumption.
- Nuclear Energy Consumption by Country: Pinpoint leading countries in nuclear energy use.
- Primary Energy & Renewables Consumption by Country: Compare overall primary energy consumption with renewable energy consumption for major countries.
- Interactive Year and Country Filtering: Enable filtering of data by specific years and countries for granular analysis.
3. Data Scope & Metrics
The analysis utilized the comprehensive "Our World in Data" Energy dataset, known for its regular updates and diverse sourcing.
Data Source:
- Our World in Data Energy Dataset: A collection of key metrics on energy consumption, energy mix, electricity mix, and other relevant variables. Updated regularly, with the first version released on September 9, 2020, and 2020 electricity mix data updated on March 31, 2021.
- Primary Data Sources (Combined):
- Energy consumption (primary energy, energy mix, energy intensity): BP Statistical Review of World Energy, SHIFT Data Portal.
- Electricity consumption (electricity consumption, electricity mix): BP Statistical Review of World Energy, EMBER – Global Electricity Dashboard.
- Other variables: United Nations, World Bank, Gapminder, Maddison Project Database.
- Data Structure: CSV file with 1 row per location and year.
- Key Variables: Primary energy, per capita energy, growth rates, energy mix (Coal, Gas, Hydro, Nuclear, Oil, Renewables, Solar, Wind), electricity mix, population.
- Data Alterations Performed by Source:
- Standardized names of countries and regions to Our World in Data standards.
- Recalculated primary energy figures from exajoules to terawatt-hours (TWh) using a conversion factor of 277.8.
- Calculated per capita figures using population data from Gapminder and UN World Population Prospects (UNWPP).
Key Data Points & Metrics Captured and Displayed:
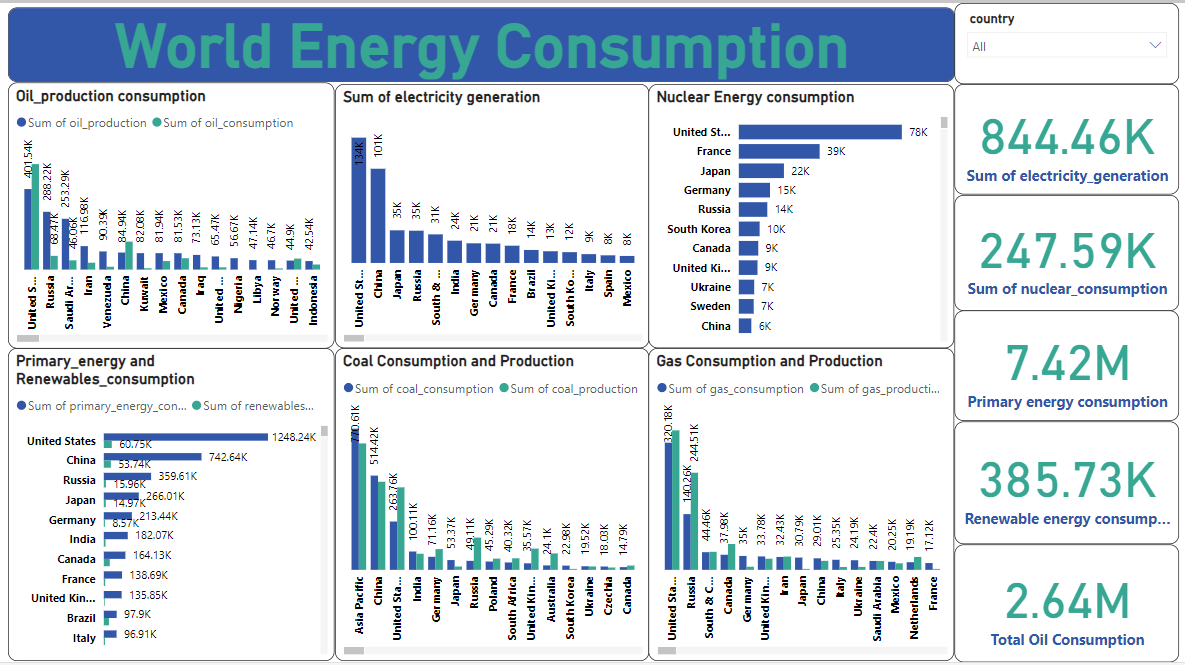
- Sum of electricity generation: 844.46K
- Sum of nuclear_consumption: 247.59K
- Primary energy consumption: 7.42M
- Renewable energy consumption: 385.73K
- Total Oil Consumption: 2.64M
- Oil Production & Consumption (Top Countries): United States leads production (368.17K) and consumption (288.29K). China, Russia, Saudi Arabia, Iran, Venezuela are also major players.
- Coal Consumption & Production (Top Countries): Asia Pacific dominates consumption (720.61K), followed by China (514.42K).
- Gas Consumption & Production (Top Countries): United States leads both production (270.18K) and consumption (244.51K).
- Nuclear Energy Consumption (Top Countries): United States (78K), France (39K), Japan (22K), Germany (15K), Russia (14K).
- Primary Energy and Renewables Consumption (Top Countries): United States leads primary energy consumption (60.75%), China (33.74%), India (164.13K for renewables).
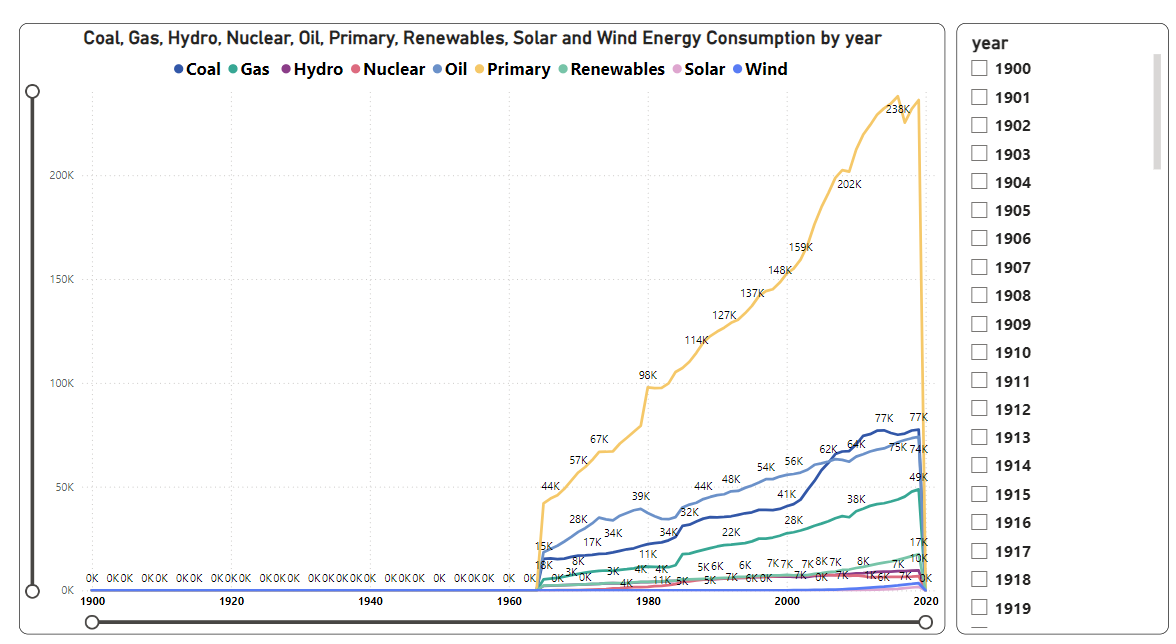
- Energy Consumption by Year (1900-2020) by Type: Shows dramatic growth in Primary Energy, Oil, and Coal over the century. Renewables (Solar, Wind, Hydro) show significant recent growth, especially in the 21st century, but still lower overall consumption compared to fossil fuels. Nuclear energy shows a steady, but less steep, increase from the 1960s.
Key Insights Derived from Data:
- Global energy consumption has significantly increased over the past century, driven primarily by fossil fuels (Oil, Coal, Gas), especially Primary Energy.
- The United States, China, and Russia are consistently among the top global consumers and producers across various energy types (oil, coal, gas, nuclear, primary energy).
- While renewable energy sources (Solar, Wind, Hydro) show exponential growth, particularly in the 21st century, their overall contribution to total primary energy consumption, while increasing, is still smaller than fossil fuels, indicating a continued global reliance on traditional energy sources.
- There is a considerable disparity between countries in terms of energy mix and consumption levels, reflecting different stages of industrialization, resource availability, and policy choices.
- Nuclear energy, while not growing as rapidly as some renewables, represents a significant portion of energy consumption in several developed nations like the US and France.
- The dashboard reveals opportunities for countries to transition towards higher renewable energy adoption, especially those with lower current renewable consumption relative to their primary energy needs.
4. Dashboard Design & Key Insights
The "World Energy Consumption" dashboard is designed to provide a comprehensive and interactive overview of global energy trends.
4.1 Key Performance Indicators (KPIs)
Prominent KPIs on the right-hand side provide an immediate snapshot of global energy metrics:
- Sum of electricity generation: 844.46K
- Sum of nuclear_consumption: 247.59K
- Primary energy consumption: 7.42M
- Renewable energy consumption: 385.73K
- Total Oil Consumption: 2.64M
4.2 Historical Energy Consumption Trends
- Coal, Gas, Hydro, Nuclear, Oil, Primary, Renewables, Solar and Wind Energy Consumption by year (Line Chart): This detailed line chart (from 1900 to 2020) illustrates the historical evolution of global energy sources. It clearly shows the dominance and continued growth of "Primary Energy" and "Oil," alongside the more recent, but rapidly accelerating, rise of "Renewables" (particularly Solar and Wind) in the 21st century. This provides a compelling visual narrative of the global energy transition, or lack thereof, over time.
4.3 Country-Level Production and Consumption Insights
- Oil_production consumption (Bar Chart): Displays a comparison of oil production and consumption by country, highlighting global leaders like the United States, China, and Saudi Arabia.
- Coal Consumption and Production (Bar Chart): Shows the major players in coal, with Asia Pacific and China prominently featured.
- Gas Consumption and Production (Bar Chart): Identifies key countries for gas production and consumption, with the United States leading both.
- Nuclear Energy consumption (Bar Chart): Ranks countries by their nuclear energy consumption, with the US, France, and Japan at the forefront.
- Primary_energy and Renewables_consumption (Bar Chart): This dual-axis chart compares overall primary energy consumption with renewable energy consumption for various countries, offering a view of their energy transition progress.
4.4 Interactive Filtering
- Year Slicer: Allows users to select specific years or a range of years to examine energy trends for those periods.
- Country Slicer: Enables filtering the entire dashboard by specific countries, allowing for in-depth analysis of individual nation's energy profiles.
The interactive elements and clear visualizations empower policymakers, researchers, and the general public to explore complex global energy data, understand trends, and identify areas for sustainable development.
5. Technical Approach & Tools
The project involved robust data acquisition, cleaning, and transformation due to the large scale and diverse sourcing of the "Our World in Data" energy dataset, followed by comprehensive analysis in Power BI:
- Data Acquisition & Ingestion: The complete Our World in Data Energy dataset (CSV format), structured with one row per location and year, was imported into Power BI Desktop.
- Data Cleaning & Transformation (Power Query in Power BI): Power Query Editor was essential for preparing the dataset:
- Standardizing Names: Implemented transformations to standardize country and region names to the "Our World in Data" standard entity names, crucial for consistent reporting across different data sources.
- Unit Recalculation: Recalculated primary energy figures from exajoules to terawatt-hours (TWh) using the specified conversion factor of 277.8. This ensured all energy consumption metrics were on a consistent and comparable scale.
- Per Capita Calculation: Created new columns for per capita figures by dividing relevant energy consumption metrics by the 'Population' variable, which was sourced from Gapminder and UNWPP.
- Handling Missing Values & Inconsistencies: Addressed any nulls or inconsistent entries in various energy consumption or production columns.
- Date Parsing: Ensured the 'Year' column was correctly parsed to enable accurate time-series analysis and filtering.
- Data Type Standardization: Ensured all numerical columns were correctly typed to facilitate accurate calculations and aggregations.
- DAX (Data Analysis Expressions) Calculations: DAX measures were created to compute key aggregated metrics:
- `Sum of electricity generation = SUM('Energy Data'[electricity_generation])`
- `Sum of nuclear_consumption = SUM('Energy Data'[nuclear_consumption])`
- `Primary energy consumption = SUM('Energy Data'[primary_energy_consumption])`
- `Renewable energy consumption = SUM('Energy Data'[renewables_consumption])`
- `Total Oil Consumption = SUM('Energy Data'[oil_consumption])`
- Measures for various energy source consumption by year, and country-specific production/consumption totals.
- Data Visualization & Dashboarding (Power BI Desktop): The dashboard was designed with a focus on clear and intuitive representation of global energy trends:
- KPI Cards: Utilized for high-level summaries of key energy metrics.
- Line Charts: For visualizing historical energy consumption by type over time.
- Bar Charts: Used extensively for showing country-level production and consumption for different energy types (Oil, Coal, Gas, Nuclear, Primary & Renewables).
- Slicers: Implemented for dynamic filtering by 'Year' and 'Country', providing granular analytical capabilities.
- Publishing & Sharing (Power BI Service): The final interactive report was published to the Power BI Service, enabling wider access and collaborative research on global energy.
6. Impact & Business Value
This Power BI dashboard for World Energy Consumption Analysis delivers significant value to various stakeholders:
- Informed Policy Making: Provides policymakers and governments with clear insights into national and global energy consumption trends, enabling evidence-based policy development for energy security, climate change mitigation, and resource management.
- Enhanced Environmental Awareness: By visualizing the shift (or lack thereof) from fossil fuels to renewables, it raises awareness about climate change drivers and the urgency of energy transitions.
- Investment Guidance: Offers valuable data for investors and energy companies to identify growth areas in renewable energy or traditional fuel markets based on consumption patterns and country-specific profiles.
- Academic and Research Support: Serves as a valuable tool for researchers, academics, and students studying energy economics, environmental science, and sustainable development.
- Resource Management Strategies: Helps in understanding global resource depletion and consumption rates, aiding in long-term strategic planning for energy production and conservation.
- Highlighting Data Expertise: Showcases proficiency in handling large, multi-sourced datasets, performing complex data transformations (unit conversions, per capita calculations), and creating impactful visualizations.
- Global Collaboration Facilitation: Provides a common data platform for international organizations and countries to discuss global energy challenges and collaborate on solutions.
7. Conclusion
This Power BI project successfully provides a robust and interactive analytical tool for understanding global energy consumption and production patterns. By meticulously transforming and visualizing the comprehensive "Our World in Data" energy dataset, critical insights into historical trends, country-specific profiles, and the evolving energy mix have been revealed. The dashboard serves as an invaluable resource for policymakers, researchers, and anyone interested in the complex dynamics of global energy, underscoring the power of data visualization in informing critical discussions about our planet's energy future.